I saw claims published yesterday that national insurance is not regressive. I have to say that I disagree.
Based on the analysis I have done of the additional national insurance that might be due if the rate cap above £50,000 were removed from those with earnings above that sum I have done two charts showing average NIC due by employees in their earnings, each based on data from HMRC for 2018/19 and shown in their data table 3.6, which I think the most comprehensive source of data on this issue.
The first uses all the income bands for which they publish data, which are shown on the X axis:
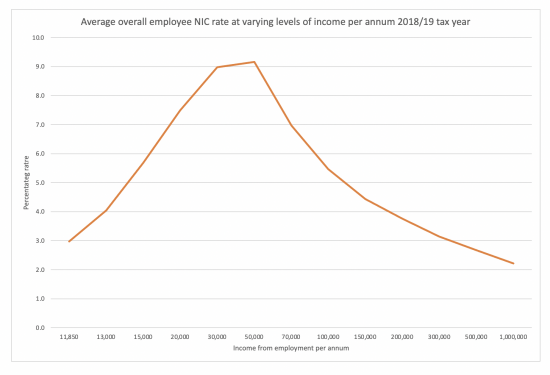
Note the X axis is not spread evenly between data points.
As is apparent employee NIC rates are indeed progressive until the point where the rate cap kicks in. That is inevitable if you have a flat-rate tax and an annual allowance, which broadly speaking (and I say that, wisely) NIC is to that point. Then the average rate falls heavily. Those on more than a million a year pay less NIC as a percentage of income than did those who were just taxpayers and had an income of £11,850 in 2018/19.
I then redrew the data, to average all income above £60,000 to approximate to a top decile of income earners. This produced this data:
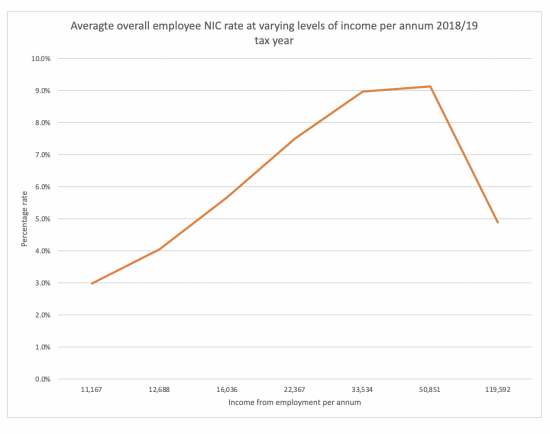
Now the tax looks much more progressive - there's just an aberration at the top, but it's not too bad as the rate still appears to be above that of many lower-paid earners. That though is just the result of playing with the data as it seems some seem to want to do when better data is available that shows just how regressive this tax is.
And I stress, this data reflects only income from earnings. As HMRC says of table 3.6:
These tables show income chargeable under the Income Tax (Earnings and Pensions) Act 2003
If income from interest, rents and dividends was added in NIC would look more regressive.
So, is NIC regressive? On any reasonable logic, yes it is. If you argue that over the majority of data points in the lower chart it is not, then you can come to a different conclusion. But it's one that is wrong because it ignores limitations in the definti0n of the tax base - and that enormously long tail to the right of the top chart which the second chart averages away.
I am entirely satisfied that NIC is regressive.
Apparently, the Institute for Fiscal Studies do not agree, but then they're the only people who think VAT is progressive, which they do by calculating the progressivity of that tax in proportion to spending and not income, so candidly, their opinion counts for little when it comes to such issues.
Thanks for reading this post.
You can share this post on social media of your choice by clicking these icons:
There are links to this blog's glossary in the above post that explain technical terms used in it. Follow them for more explanations.
You can subscribe to this blog's daily email here.
And if you would like to support this blog you can, here:

 Buy me a coffee!

The IFS themselves say “while NICs are progressive across most of the earnings distribution – the average tax rate is higher for those earning more – it is not progressive at the top“.
They have a graph that shows the marginal rate of NICs against earnings, including employer contributions, arguing that they all reduce employee pay. As your figures show, it is even more apparent when you focus on employee contributions.
But they also have a graph that shows the impact of NICs by income decile, that shows broad progressively until the last income decile.
If the structural features of a tax are designed to ensure that the very higher earners pay proportionately less tax, by definition the tax is not progressive. https://ifs.org.uk/taxlab/taxes-explained/national-insurance-contributions-explained
If NICs is treated as just another tax on earned income, and it is added to income tax on the same earnings, then the total is broadly progressive across the board, but that ignores the preferential treatment of unearned income and capital gains.
Agreed
I meant to add, the linked IFS analysis points out something that is obvious if you think about the rate structure: 58% of NICs are paid as employer contributions, 39% as employee contributions, and less than 2.5% by the self employed.
So it is primarily a payroll tax: a tax on employment.
Which is not what we need…
Richard,
Do you know what the split in total national income is between liable for National Insurance & not liable for National Insurance?
No – sorry – I could work on it but don’t have time
I haven’t found a specific answer, but according to ONS statistics, there were 29 million people on payroll (i.e. employees) to March 2020. The number dropped to 28 million in November, and is climbing back again. 95% of these (about 27.5 million) are between the ages of 18 and 64, and almost all of these should be paying NICs. See https://www.ons.gov.uk/employmentandlabourmarket/peopleinwork/earningsandworkinghours/bulletins/earningsandemploymentfrompayasyouearnrealtimeinformationuk/august2021
By comparison about 32 million people in the UK pay income tax. The total UK population is estimated to be 67 million, with about 60% between the ages of 16 and 65 (about 40 million) plus about 20% under 16 (about 13 million) and about the same over 65.
So something like 3 million people pay income tax but not NICs, and something like 1.5 million of those are on payroll but not paying NICs due to their age (under 16, or over retirement age). That leaves about 1.5 million people who appear to report taxable income but don’t pay NICs to presumably only have income from a source other than earnings.
As to amounts, there must be some statistics out there somewhere. I would not be at all surprised to see this is heavily weighted towards people in the upper one or two income deciles, who receive significant interest, dividend or rental income.
This sort of work shows how heavily weighted gains (and the non-earnings income that those assets produce) are towards the upper income decile, indeed the top 1%. https://warwick.ac.uk/fac/soc/economics/research/centres/cage/manage/publications/bn27.2020.pdf
Table 3.6 I quoted has only 24.2 employees plus more than 6 million pensioners.
OK, so there is a job to be done in reconciling the figures. I expect my 29 million on payroll includes both your 24 million of employees and 6 million pensioners from Table 3.6 (I think you are counting those in receipt of state pensions – Table 3.6 shows almost 8 million people in receipt of other pensions, and no doubt that includes most of the 6 million plus some others, mostly in the 13 million or so of the population who are 65 or older).
To add to the mix, this paper shows (in 2018-19) £786 billion of employment income, £155 billion of pension income, £85 billion of self employment income, and £92 billion of property, interest, dividend, and other income, https://assets.publishing.service.gov.uk/government/uploads/system/uploads/attachment_data/file/974540/SPI_National_Statistics_Commentary_tables_3_1_to_3.17_1819.pdf
But of course is is not all distributed evenly across income deciles, and does not include the £65 million+ of reported capital gains.
There must be some overlap…
Could someone tell Andrew that the current retirement and non-payment of NI age is 66. I can’t see how to reply to his post. Thsi is important to me as I am currently 65.
Thanks, Cyndy. Indeed, and under current plans the retirement age will be sliding up again in a while to 67 and then 68. I appreciate that 64 and 65 were not ideal cut offs for my post above, but I could not find figures divided it up in other ways.
The ONS age pyramid has some interesting nips and tucks and bulges, including a large post-war step at age 73 (in 2020), and a notch at age 79 and 80, but there are about 700,000 to 900,000 people in a similar position to you in each younger year group affected by the change of retirement dates.
https://www.ons.gov.uk/peoplepopulationandcommunity/populationandmigration/populationestimates/bulletins/annualmidyearpopulationestimates/mid2020
If you play the animation from 2001, you can see the march of demographics upwards.
Does the blanking of non-salary income in most people’s view of NI fairness just reflect the practical desirability for tax to be easily and preferably automatically collected? That is what happens with PAYE, which means there are easily found figures which everyone quotes.
I think one aspect which your Tax Research organisation might look at in addition to the fairness of tax is the practical aspects of collection. Taxes (whether or not labelled NI) on non-salary income will remain in the government’s “too hard” category unless someone can demonstrate a way of straightforward identification and collection, ideally at source. To an even greater extent the same applies to proposals for some sort of wealth tax.
We do have a self assessment system that works for all but the corrupt
There is a system to collect income tax at source from non-earnings income. It is essentially the same as PAYE, and it is called withholding. The person making a payment has to withhold (that is, keep back) tax on the payment, and account for that amount of withheld tax to the tax authority, typically in the UK at the 20% basic rate of income tax. The payer can be chased for the tax payment even if they fail to collect it.
The recipient only gets a net amount, the 80% in the UK, but is usually able to claim a tax credit for the amount withheld and set it off against their tax on the payment, which may be more or less than the amount withheld, and then either pay any extra that is due or (in some cases) claim back the excess of tax withheld.
UK banks used to withhold basic rate income tax on most interest payment until 2016, when the taxation of interest was changed. Withholding still applies to many payments of interest by UK borrowers to non-resident lenders. UK tenants of non-resident landlords have to withhold basic rate income tax on their payments of rent, unless the landlord is registered to be paid gross under the non-resident landlords scheme (and undertakes to file UK tax returns). The UK had something similar to withholding on dividends, in the form of advance corporation tax, until 1999. Even after ACT was abolished, dividends carried a notional 10% tax credit until 2016.
In principle, withholding can be simple, but in practice it can lead to a cumbersome merry-go-round of deductions and claims and payments and repayments. The cum-ex scandal was based on transactions intended to allow two people to claim credits for tax withhold on dividends, for example.
That said, many other countries still levy withholding on dividend payments, some require withholding on capital gains particularly on land (the US does both) and some even require withholding on payments for services, particularly for payments to non-residents (eg Brazil). Where there is the political will, there is a way.
And there was tax withhold9ng on overseas rents too…albeit you could always apply for it to be paid gross
Thanks, basically the solutions that exist don’t fit what I see as the necessity to be straightforward.
Self-assessment would create a lot of bureaucracy, and from my limited experience it isn’t that easy. (I received some untaxed income for the first time in decades last tax year, and have been trying to declare it. To file online you apparently need something called a UTR, but despite twice requesting one nothing has been provided and without it I can’t even get to first base). It seems to me it would end up as a job creation scheme for accountants, which to be fair the government might welcome if it could be sure to reserve those jobs for Conservative-voting accountants ….
Witholding is a better solution when there is a legal organisation involved, like building societies paying interest or limited companies paying dividends, particularly if there is a single rate applicable to everyone. But it isn’t practical when it is everyday transactions, like my student daughter paying her share of the rent on the jointly occupied house.
Good luck with the UTR
You need a government gateway account first….
If you have received any correspondence from HMRC, it is likely to mention your Unique Taxpayer Reference (UTR) . Or there is https://www.gov.uk/find-lost-utr-number Good luck with the helpline!
As I said, there are a number of situations in which UK taxpayers are already required to withhold tax from payments. It would be relatively simple to require withholding on account of tax on all payments of interest, dividends, rent, capital gains, for goods, and for services. I’ve heard it suggested as a way to prevent avoidance in the cash economy, for example. You could imagine an expanded Construction Industry Scheme, where every payment is subject to withholding unless the recipient is registered for gross payment (because it on a public register, and known to HMRC with a good compliance record). That is what collection at source means. Otherwise you are dependent on tax returns being filed by the recipient.
Judging by my problems with just getting the UTR I need to declare tax, there will be a huge proportion of the public who will struggle mightily if they have to report a withholding every time they pay their rent, or the window cleaner. Not straightforward.
Emboldened by Andrew’s encouragement I looked back and found correspondence from HMRC, my notification of tax code. No mention of a UTR. But all my income has been PAYE for many years, until last year’s one-off oddity.
I have a government gateway account (I needed it to apply for my state pension, as I recall) but while that takes me to a “Personal Tax Account” page there is no place to request a UTR or find one already issued. Frustratingly I can’t now remember the pathway through the government website I have already navigated twice this year, and each time filled an online request form without getting anything. Maybe the only way is to spend time hanging on the phone waiting for their helpline to answer …
You would have thought they would make it easy when someone acknowledges they owe some tax.
For some reason, it was all worked fine when I needed a UTR for my late mother’s estate last year, and following the request it quickly arrived in the post (there was CGT to pay after her house sold for more than the probate valuation).
It is a mighty frustrating system, I agree
Sorry you are struggling.
I’ve just logged into my personal tax account at https://www.gov.uk/personal-tax-account (using identify verification through the Post Office that I set up some time ago – I only use it about once a year to file a tax return). If you have this set up, the very first line gives your UTR.
I don’t know how easy it would be to set up through https://www.gov.uk/personal-tax-account/sign-in/create-account but it might save some time. For what it is worth, this sort of online self-service is the future.
From a less astute and learned perspective, let me give thanks to those sticking this out to get to the truth of the matter.
The first graph though seems to indicate once again the ‘squeezed middle’ of the income range is taking the biggest hit – the steep climb in the lower incomes is also indicative of a regressive trend. The second graph somewhat apes the first.
But to see it decline so rapidly in the upper income brackets………………………..I mean, it’s just not on really is it?
No…..