I was interviewed twice on the radio on Friday evening to discuss John McDonnell's new fiscal rule, once on LBC and the other on Radio 5. In both cases the interviewers were quite explicit in stating that it was known that Labour always borrowed more than the Conservatives and that was why the electorate could not trust them with the economy. I knew that evidence I had prepared a year ago did not support that view in recent years (post 1997) but I decided to see if this claim really had any substance to it all at all. This blog is about my findings. There is a note on data sources at the end.
The first task was to secure data on borrowing by year from 1946/47 onwards: this data covers a 70 year period. Labour was in office for 28 of these years and the Conservatives for 42.
The next task was very simple: I calculated the total net borrowing in Labour and Conservative years and averaged them by the number of years in office. All figures are stated billions of pounds in all the tables that follow and in this case are in original values i.e. in the prices of the periods when they actually occurred:
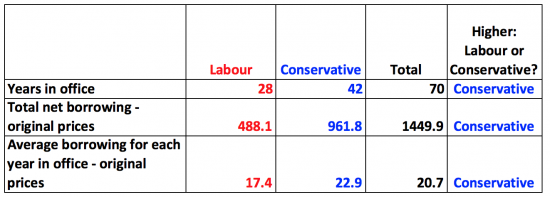
The Conservatives borrowed more, not just absolutely (which is unsurprising as they had more years in office), but on average.
This though, is a bit unfair: the value of money changes over time. So I restated all borrowing in 2014 prices to eliminate the bias this gives rise to. This resulted in the following table:
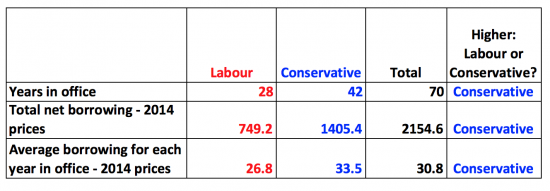
In current prices the Conservatives still borrowed more (much more) overall, and on average, by a long way.
So then I speculated that this may be distorted by events since 2008. That is what the Conservatives would claim, after all: they would say that they have spent six years clearing up Labour's mess. So I took those years out of account and looked at the first 62 years of the sample. First I did this in original prices:
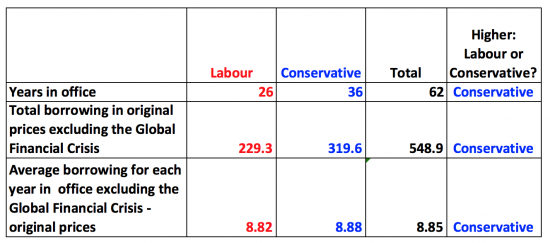
That was close! So I did it again in 2014 prices:
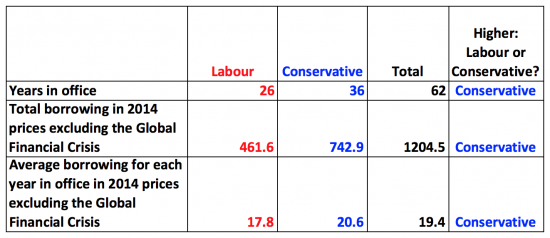
Not quite so close after all: Labour definitely borrowed less.
Then I speculated that this might be because Labour are good Keynesians: maybe they repaid national debt more often than the Conservatives. Or, to put it another way, they actually repaired the roof when the sun was shining. This is the data in terms of number of years:
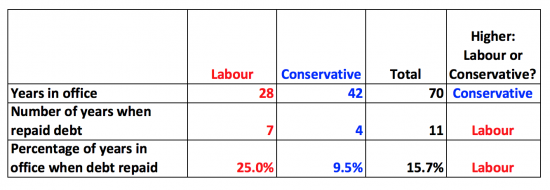
Labour do walk the talk: they repay national debt much more often in absolute and percentage terms than the Conservatives. In fact, one in four Labour years saw debt repaid. That was true in less than one in ten Conservative years.
But maybe the Conservatives repaid more. I checked that. This is the data in both original and 2014 prices:
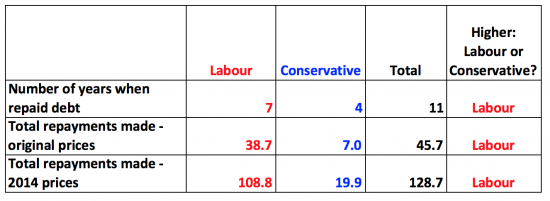
Labour not only repaid more often, it turns out: it also repaid much more in total and on average (not shown) during each year when repayment was made.
So what do we learn? Two essential things, I suggest.
First, Labour invariably borrows less than the Conservatives. The data always shows that.
And second, Labour has always repaid debt more often than the Conservatives, and has always repaid more debt, on average.
The trend does not vary however you do the data.
Or, to put it another way, the Conservatives are the party of high UK borrowing and low debt repayment contrary to all popular belief, including that of most radio presenters. Which means that the next time I am presented with that nonsense I will be very firmly rebutting it.
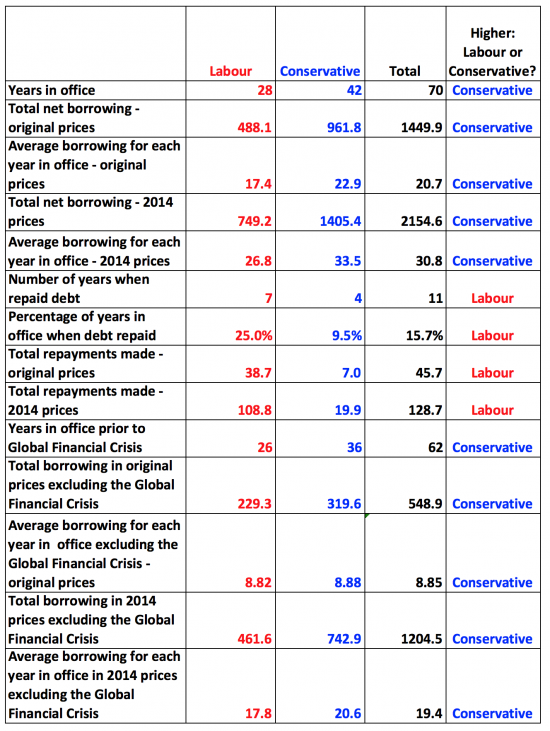
For those interested, this is the overall summary table: the pattern in the right hand column is really quite surprising:
Data sources
The basic data on borrowing came from the House of Commons Library.
GDP data from 1955 came from the 2015 budget GDP deflators. The 2015-16 estimate came from the July 2015 budget report. The data for the period period to 1955 came from the Bank of England. Data was checked to the Treasury Pocket Data Book: as is usual there are minor differences, but too small to worry about.
GDP deflator data came from similar sources but was estimated for 2015-16 based on 2014-15 and for the period prior to 1955 based on data for 1955 - 65. It is unlikely that this estimate materially changes any finding.
Governments in office for a year were determined in election years by the number of days each had in office: the party with the greater number being attributed the whole year.
Thanks for reading this post.
You can share this post on social media of your choice by clicking these icons:
There are links to this blog's glossary in the above post that explain technical terms used in it. Follow them for more explanations.
You can subscribe to this blog's daily email here.
And if you would like to support this blog you can, here:

 Buy me a coffee!

Interesting data, but were the radio hosts focusing on the right thing? The one thing I think I have learned since starting to follow this blog that assessing whether running deficits or paying off debt is good or bad for a socially just economy rather depends on the economic circumstances at the time?
They were, of course, looking at the wrong thing
The household analogy was in full swing
Very nice analysis. I have long thought this was the case. I seem to remember a similar Democrat/Republican analysis in the US showing similar results with the Decocrats winning by a substantial margin.
The Tories doubled borrowing in absolute terms in 5 years in coalition. A significant contributor to that was the huge deficit inherited from Brown. Surely that skews all your figures? Effectively you are saying the state of the economy each government inherits is irrelevant and deficits can be remedied in a single year.
First, please note what I wrote. I specifically tested to see if this changed the results: it did not
Second, Brown suffered a global financial crisis caused by banks
Please get your facts right
Goodness me. Blame everything on the “global financial crisis caused by the banks”. I had you labelled as more sophisticated than a man who just repeats labour HQ lines. Obviously not. Cue a host of replies from your supporters seething at the banks and absolving Brown of any blame whatsoever……………
Look at the data: for 62 years Labour underspent the Conservatives
Are you saying there is something wrong with that data?
Goodness me Jim. Blame everything on ” Brown and the Labour Party”. I had you labelled as more sophisticated than a man who just repeats Tory HQ lines. Obviously not. Cue a host of replies from your fellow forelock tuggers seething at the alternatives to neo liberalism and absolving the Banks, the City and casino/rentier economy of any blame or responsibility whatsoever……………
Nice touche Dave.
Jim it seems you are a “global financial crisis” denier, have you any knowledge of economic history at all or just politically blinkered to the glaringly obvious reality?
No denying the credit crisis here. Just pointing out that parroting “global financial crisis caused by the banks” and then sticking your fingers in your ears isn’t useful to anyone.
The truth is a real bugger, isn’t it?
well said Richard, typically the Tories and their supporters don’t like criticism
Hi Jim,
Why do you think the global financial was caused by Labour/Brown – do you have any figures to back that up? I’d probably agree with you more if it was only the UK that was affected. But the clue is in the word “global” and many countries suffered including the USA which was Republican at the time and who would probably best be described as pro-bank. Arguably the US exported the crisis through the repeal of Glass—Steagall helped.
Hi again,
If Labour/Brown/Blair were doing such a bad job why did Osbourne pledge to match Labour’s spending plans.
http://www.telegraph.co.uk/news/uknews/1562023/Tories-vow-to-match-Labour-spending.html
Perhaps you could also consider facts before being obnoxious and rude. No one denies the global crisis was a big part; but a good chancellor always plans for a future recession, and Brown’s planning was poor. This meant when it arose we were in a poor position to combat it.
Please get your facts right.
Governments have no need to save
They are not households. They can always print money
Get your facts right
We did not face a crisis in 2008: we could borrow all we wanted. That was all that mattered
You are totally in the wrong
And if anyone is being rude it is you by making wholly groundless claims
You allowed for the deficit inherited in 2010. Jim did ask if the state of the deficit at each handover skewed the figures.
You’ve allowed for one such handover.
Further, of the 7 years of labour debt repayment, four were between 98-01. They inherited an economy with strengthening public finances.
It’s easy to see how these figures can say anything you want them to say. How do you allow for the state.od the inherited economy? I don’t believe it is fully allowed for in your analysis.
I was testing a simple assertion – that Labour always borrow more
They don’t
I fully sccept that there may be all sorts of explanatory factors – although saying they don’t because the Conservatives go out if their way to help them seems the most unlikely one – but that is not the point
I tested an assertion, based on perception, and it was wrong
I made no more claim than that
Thanks for this Richard.
I was so disappointed that Labour didn’t bat the blame away well enough about the economy during the election, I had a hunch that it would be their achilles heel in the end.
Surprise surprise, the world and his dog would have you believe that all that’s bad about our economy is due to Labour’s mismanagement, when all along the mantra directed to the gullible public by the usual sources (media/papers/politicians etc) has convinced them otherwise.
WAKE UP!
As I said in my moan about Channel 4 the other day, there is so much bunkum about Labour’s economic record that has become ‘received wisdom’ in society that it is becoming a real threat to democracy and choice.
Your work above is a supremely useful piece of analysis – it’s a public service. Thank goodness for it and You.
Your findings seem to support what I read by Christopher Johnson (‘The Economy under Mrs Thatcher, 1979-1990’).
Johnson gives a cool and detached analysis and the overall picture is one of a mix failures and successes, with the successes coming in at a real high cost (high unemployment for example and a huge increase in private debt).
But the real common thread between Johnson and your work above is how stupid the Tories are. In fact I would call it ‘economic illiteracy’.
It is this: they so hate the public sector (including the role of the State) that they seem to want to find alternatives to feeding the economy money – for example – through private debt or ‘funny money’ – rather than real money and these factors actually create more instability in the economy and thus actually end up requiring the Government to step in. And not only step in, but step in with more stop gap measures (more Government money) than would have been needed if they had just made the correct investment in the first place.
Not only that, because of their use of less tax as vote winner (but also as Johnson points, their preferred use of VAT which he thinks reduces consumption and is actually self defeating in terms of raising tax) the Tories have less money to pay off any debt. Hence higher and longer debt. And it is all to do with their negation of the public sector as a supply portal of real money to support the economy.
Now I could be wrong because I am no expert – this is not my full-time job – but this is how it seems to me. The Tories own ideology (‘idiotology’) actually works against them. And also works against us.
And here were are in 2016 and they are at it again. And the only thing that seems to be letting them get away with it is the lies that are being told and supported in the media about Labour.
A Russian novelist would have a field day with this concept.
I agree with your hypothesis
Austerity is the best example: it simply makes it much harder for George Osborne to balance the books and yet he does it
I assume you mean he does austerity not that he manages to balance the books, Richard, which he doesn’t (and is also the best book-cooker in the business, with the help of the OBR).
Having seen his limp display on Andrew Marr he seems to me a man on the way out.
Incidentally, Sean Danaher’s comment is correct. There was a similar analysis done a few years ago that showed that the Democrats routinely do the same in the US as you’ve shown for Labour in the UK.
Of course, the underlying issue here – as in the US with the Republicans – is that the Tories are seen as the natural party of business and so it must follow (in layman’s logic) that they are better at the economy than Labour. This is what the media in the UK have run with for decades. Indeed, I remember my grandfather saying it to me back in the 1970s when I asked him why he always voted Tory (though he hated toffs). And my father took the same view – even though he was a Liberal voter. Jump forward to 2016 and I still routinely hear this obviously inaccurate myth repeated on a regular basis.
And I even I was surprised the data was so starkly the other way
Excellent data analysis, it is really useful to have.
What I don’t get is the Tory obsession with their spiteful-Austerity?[1]
1. Deeper cuts are counter productive. [2]
2. Osborne’s raison d’être for faster cuts to stem future higher interest repayments has been removed with near-zero long term interest rates.
3. There is currently inadequate long-term investment. Economic multiplier effects of investment are larger in times of economic crisis. [3]
4. “The digital economy has made the UK a richer and faster-growing country than official figures suggest”. [4] Therefore copy south Korea invest in ultra-high speed fibre end-to-end. Competitively fund 100,000 computer apprenticeships over 5 years in industry relevant areas. Teach fundamental IT skills in our universities and schools, many university computer science departments do not teach fundamental skills such as, number systems, assembly language and c language.
5. Invest in: social housing, public transport, university research, digital economy (fibre network) and small businesses for a start.
6. Tory obsession with making [punishing] the poor and disabled worse off — these citizens spend all their income which is fantastic for the economy rather than save [hoard] money.
[1] Osborne announces he will cut “50p from every £100 the government spends” by 2020 i.e £38B more cuts on £760B spending (2016 figures). http://www.ft.com/cms/s/0/cc27899c-e901-11e5-bb79-2303682345c8.html#axzz42jBJ0YDc
[2] J Van Reenen, “Austerity: Growth Costs and Post-Election Plans”, 2015
http://cep.lse.ac.uk/pubs/download/ea020.pdf
[3] ‘Growth Forecast Errors and Fiscal Multipliers ’ update by J. Mohlmann, W. Suyker 1/12/15 http://www.voxeu.org/article/blanchard-and-leigh-s-fiscal-multipliers-revisited
[4] Sir Charlie Bean, former deputy governor of the Bank of England, in FT.COM 2015 http://www.ft.com/cms/s/0/69b31022-3ac1-11e5-bbd1-b37bc06f590c.html#axzz42jBJ0YDc
Decimal point missing. £3.8B. [1] Osborne announces he will cut “50p from every £100 the government spends” by 2020 i.e £3.8B more cuts on £760B spending (2016 figures).
Austerity is the point, not the process.
Everything is just window dressing, frequently discarded and replaced by the likes of the OBR.
John mcdonnell was depressing this morning, throwing about UKPLC,entrepreneurs, wealth creators in a desperate attempt to seem grown up his interrogator.
Why not talk about things that matter?
What was he on?
Another weird aspect of your observation Ivan concerns the voting behaviours in which working people in certain locales and factories would regularly vote for communist shop stewards in the workplace and Conservative and Unionist in General Elections.
The only plausible theory I’ve heard for that one is selfishness, wanting the (perceived) best of both worlds.
Osborne has to impose austerity, because if he did the economically sane thing and borrowed and spent to stimulate the economy, then he couldn’t starve the NHS of cash till it failed and gave him the excuse to ‘seek private investment’ (ie sell it to his friends).
Could he.
You might like this on labour’s credibility problem, I came across it yesterday :
“One reason is that voters have bought the story that Labour “over-borrowed” in the 00s. I’ve argued that this story is false – its borrowing was a reasonable reaction to the savings glut and investment dearth — but its plausibility has been enhanced by some Labour figures’ self-abasing desire to apologize anyway.
There is, though, something else. The fact that Osborne is wrong is, paradoxically, an advantage for him. The reason for this has been pointed out in a new paper by Peter Schwardmann and Joel van der Weele. They show that people who deceive themselves are better able to deceive others. This corroborates research by Cameron Anderson and Sebastien Brion, which has found that the over-confident are more likely to be hired than more rational candidates, because they send out more “competence cues”, and so their irrational overconfidence is mistaken for actual competence. As Matthew Hutson says, “to be a good salesman, you have to buy your own pitch.”
http://stumblingandmumbling.typepad.com/stumbling_and_mumbling/2016/03/labours-credibility-problem.html
That’s an important insight -bullshit ‘works.’
Well done Richard, it’s odd that Labour’s economic advisers hadn’t worked that out many years ago?
So no more apologies, can they just get their act together and start ripping into the Tory lies before Osborne lets loose another full frontal assault on the poor and vulnerable of this country.
The Tories have re-started class war, so it is about time the non-Tory majority of this country are shown there is still a party that will really fight on their behalf.
“can they just get their act together and start ripping into the Tory lies”
One would hope so but we’re talking here of a fearful and stressed populace with little head-space and have to resort to shite TV/Games Consoles as a partly understandable escape route. Unwinding years of myths is going to be a long process a sort of ‘de-Naizification’ of the economic world. I think our hope is with the young who are showing signs that they are fed up with this ‘crap’ and really want change -but I fear we are talking some years hear as the fearful middle class turned a blind eye to the hit the vulnerable are taking so they won’t be touched themselves and the three/four cars and foreign holidays on ten story cruisers are threatened.
Sadly most of the “I’m alright jack” crowd will one day discover they are not, as without substantial wealth they will suddenly realise that the future is very bleak. We are almost all just one accident,illness or misfortune away from total insecurity.
Is money debt? If so who are the debtor and creditor?
Government owes
And it creates private wealth in the process
http://www.learningmarkets.com/understanding-the-fractional-reserve-banking-system/
Yes, the only real money to exist is the interest. The rest are made up figures on accounts
I’ve been asking that question for years!! I have a credit card and a mortgage and I know who my creditors are (or at least who will come knocking for my debt)
If removing the 7 years of data from 2008 is valid ( as it disadvantages whoever is governing after that ) then so too should the first 7 years be removed, as it advantages the parties that presided over the cuts in defence spending after the Nazis were defeated.
I only removed the last seven years to dismiss an argument that would otherwise have been presented
Why not remove all Tory years if that is your claim?
Dismissing extreme data periods is a valid thing to do. But it’s only valid if done at both extremes. Any one starting from 1946 is advantaged. Anyone starting from 2008 is disadvantaged.
I suggest you use the 70 years of data
I am happy to do so
That is the modern economic and political era
Mr Estuncon, it shouldn’t be beyond your wit or imagination for you to work out the figures excluding the “first 7 years” and so see for yourself whether your lazy assumption is right or wrong.
That you can blithely present a proposition without bothering to confirm or disprove it suggests to me that you are a supporter of the government’s consistent approach over six long years of presenting opinion as fact and using its mates in the media to amplify its propaganda to a level that those who cannot or will not investigate blindly accept. I’m not.
For the record if you take out first and last 8 years Labour borrowed less overall, but more per year on average by about £1 billion, whichever basis is used
The number of years of repayment is equalised, but Labour still repaid relatively more often and much more i.e. it was more Keynesian
But I have to say I am not sure what this random process proves unless it says pick the sample to bias a party, which I think is the point of the request
The purpose is to take out the biases – removing extremes of a data series is pretty standard in statistics.
I fully understand
But it does not do that in this case
Next I suspect you will ask for it from 1997 to 2010 and suggest that poves Labour borrowed more
Not at all. 1997-2010 doesn’t fit the extreme criteria.
The beginning and end of the series meets two criteria for being extreme, being the oldest and the most recent, and also the most advantageous and the least advantageous starting point.
In financial terms a conclusion that both sets of chancellors have been as bad as each other is fair.
Anyway as analysts such as Lynn and Vanhanen have found the prosperity of a nation is most strongly correlated with IQ, a free market economy and natural resources, of which only the middle one is under the control of a typical government.
Respectfully, birth rates in Denmark are strongly correlated with the number of storks nesting in a year. It does not prove storks bring babies
If you separate (Mr) Estuncon into Est un con maybe that explains him !!
I’m no economist so I’m very willing to be corrected, but I’m not convinced by the argument the immediate post war situation was advantageous: There was massive debt, rationing was still in place and much of the country’s infrastructure had been damaged in the war. The Tories campaigned on a relatively austere (in comparison to Labour) manifesto, claiming many of Labour’s proposed reforms were unaffordable. If the immediate post war years were advantageous, it’s because Labour policies were effective, surely?
I agree: I found the argument perverse
Don’t forget the USA stopped Lend Lease 30 days after the end of the war. The UK had liquidated its overseas resources to fight the war before the US started Lend-Lease. One of the reasons rationing actually deepened after 1945, and why the Labour Government had to take out loans from the US.
Just as when Labour came to power in 1984 there was the result of the Barber boom to sort out, and the oil price rise in 1973/4. Indeed to be fussy, revised figures – the ones that got Mr Osborne out of his double dip position – showed that the UK needn’t have called in the IMF under labour either.
Not a Labour supporter but a firm believer in facts.
Also, as 6 of those 7 years were Labour governments, removing them would presumably reduce Labour’s average annual borrowing even further relative to Conservative. So what do you hope to achieve?!
I have checked and taking them out does not change the outcomes
Brilliant work. Only yesterday i heard someone saying that Labour always borrows too much. It has become received wisdom and must be corrected.
I should have added that I sincerely hope that whoever controls the information that gets circulated around the PLP and the Labour Party membership more widely sees this blog and circulates it. Reference to it should then become mandatory every time any reporter raises the issue of government debt, economic competence, etc.
Oh yes, and John and Jeremy and your advisers: some Sunday reading for you.
Consider firstly the validity of this simplistic view: Tories have intentionally over-borrowed in order to minimlalise tax burden on the rich. However one scutinises, looking at the long-term analysis it seems more feasible that the Tories are intential mis-managers more than flawed managers of the public purse. Please advise if I’m making a wrong connection, but surely what smacks us between the eyes is that corporate welfare has always been the Tories’ ‘thing’, just that it’s gone from our being blind to it to it being blatant.
Brian you are of course very right. The Tory agenda is not to reduce government spending at all, they are only concerned about how and from whom the tax is raised and how and to whom the money is transferred.
The dominant ideology for the US and UK conservatives has been to shift the burden of tax receipts from the corporate and wealthy and onto the private and low/middle earners (topped up by borrowing from the corporate and wealthy at interest), while the government expenditure has been shifted from public welfare to corporate welfare and tax allowances.
The incredible trick they achieved was to fool the public and most academics (and even the New Labour muppets) for so many years that this was not only the plan but actually what was happening on a global scale.
That has been one of the greatest propaganda coups since that German bloke with a funny moustache who can’t be mentioned!
Just out of interest, have you run these figures from say, Thatcher onwards, or starting with Blair? Would be interesting to see how it breaks down when taken in context of certain periods in history. For example your period includes directly after the Second World War. Would that not also skew the figures much like the financial crisis of 2008? It would also be interesting to see this data broken down by individual government.
I really think taking the post war period as a whole is totally fair
But I have noted what happens if you take out eight years after the war
Ah I see above you mentioned this still does not massively skew the figures. Please bear in mind I am a firm believer Labour’s current direction of investment in much needed infrastructure and services is absolutely correct. I just tend to think now in terms of “how are the Tories going to spin this one?”
Brilliant Richard.
Always wonder what the interviewers base their assumptions on if not outright bias. Can understand it with (L)ondon (B)ased (C)onservatives but not with Radio 5
Richard-next time you are interviewed and the usual blarney about the Tories comes out maybe you can press a button that displays these charts with flashing neon-lights while megaphoning at ear shattering volume the real facts.
Important blog which use the language framing of the neo-lib agenda against it-just what we need.
Not with R5? they are one of the most right wing biased stations on the BBC, who have become the governments propaganda arm! The BBC start from a neo liberal bias these days. things changed at the BBC a few years ago. no lefties left now.
I thought you wanted the government to increase deficit-funding of the economy. Does this mean you are now in favour of austerity?
Of course not
I was just pointing out some facts
Ok, I think I have finally realised something due to this post…
I had always assumed that countries (or governments, some how I feel there is a distinction even if its a bit “wishy washy”) borrow from other countries, and as such there must be some country that is massively gaining cash from all the other countries running deficits/debts. The whole “if all the countries owe money, then who do they owe it to?” question that people like myself, with no real understanding, wonder.
But it seems from one of your replies that the money is owed to private people. The question then becomes, if countries create the money by printing it (re:QE, or just in general) or creating credits/debts in some massive ledger… then how do the private people get the money to loan to the governments – who creates the money they then loan out to governments?
Further this leads to a rather silly question, what would happen if all the governments of the world decided en-mass to say “sod this for a laugh, none of you private people/entities are getting a penny more; we’re resetting the system to 0 and cancelling all out standing government/countries debt”.
Start here
http://www.taxresearch.org.uk/Blog/2015/07/09/george-osbornes-planned-budget-surplus-requires-some-heroic-and-wholly-implausible-assumptions/
Where do people get money from? They earn it
they earn it from whom? Someone must pay them? That’s a very disingenuous answer. There are so many things not covered in this thread…. like the sale of gold by Brown, the destruction of pension funds, also Brown, and generally the state of employment and the resilience of the UK economy in the face of a global crisis… mentioned but not given much weight.
The sale of gold was a reserves restructuring and does not impact the data or I would gave included it
No pension fund was ruined by Brown
Your trolling gas been noted and will be deleted
Not all countries owe money, some are lending it out. Norway for example, has saved most of the Oil money into a fund, apparently the biggest in the world, and it is currently on around 7000 billion kroner or around 6000 billion GBP. Every year they take out 4% to spend in the budget, and I think the fund have increased every year since the start, except for the first 2 years of the current financial crisis. They have invested in lots of things, like lending to other countries, stocks and property and “own” parts of high market shopping streets in London and many other places in the world. If the UK Government had done the same under Thatcher, the UK would now have had a very big saving to fall back on, instead of a humongous debt.
As I understand it, the government borrowing does not include the various PFI projects. These were effectively a way of borrowing without it appearing as debt. If this was recognised as debt, would it change the comparison?
I think you will find the figures broadly similar under governments of both hues
And much smaller than you might think
I wonder how buying and selling of nationalised assets would also effect these totals? I’ve never really understood why selling national profit making assets is less criticised than borrowing. Both seem to me to have comparable long term costs.
Apologies for the lack of effort, I’m just off to work and thinking out loud.
It would impact them – but since the Conservatives did most would make their situation worse
That’s what I thought. Presumably much worse as most national assets would have been bought or built under Labour, appearing as borrowing, and sold under the Conservatives reducing borrowing. Unless I misunderstand how the figures are generated. No doubt that is still a simplification but I don’t see how it can do anything but strengthen your argument. I found this figure for the assets sold during the 80s.
“At 1997 prices, almost £67billion was raised in revenue from privatisation in 1980-97.” [1]
[1] http://www.economicshelp.org/macroeconomics/privatisation/privatisation-uk/
I would have thought it was worth Labour doing a bit of research to make this point comprehensively.
It could be done….
And, significantly, during the 18 years of tory rule through the 80’s, we had significant oil revenue, the size of which has not been repeated, therefore the extent of tory financial mismanagement is even worse.
http://www.newstatesman.com/politics/2013/04/thatcher-and-north-sea-oil-%E2%80%93-failure-invest-britain%E2%80%99s-future
The household analogy is itself flawed. If you’re in a Micawber position, cutting expenditure won’t help. In the long term basic costs of housing, energy, food , clothing will always rise. So you will have to keep cutting until you are destitute. The only way out is to increase your income and that has proved impossible for the bulk of the population of this country for many years.
Richard, does this mean you support Osborne’s projected increase of the deficit? Your stance really confuses me. Reading your blog confuses me.
No of course I do not support Osborne
I am just pointing out some facts
This reminds me of Thom Hartmann’s video on Jude Wanniski’s Two Santa Claus Theory.
http://www.thomhartmann.com/bigpicture/hartmann-has-ows-blown-republican-santa-claus-theory
Not only have the UK Tories been lying about the deficits and debt but the US Republicans have been at it for decades.
http://economix.blogs.nytimes.com/2012/03/20/the-origin-of-modern-republican-fiscal-policy/
http://www.democraticunderground.com/10021632181
http://www.truth-out.org/opinion/item/13023-santa-claus-faces-the-democratic-firing-squad
Boring. Distracting sense with statistics.
Labour repay more in their initial years in office after inheriting hard won surplus from tory years.
Tories borrow more, initially on taking office, to correct financial devastation wreaked by previous Labour government.
Quod wrath demonstrandum.
But I admire your attempt at sleight of hand! Look at all the sheep baa-ingredients above here!
Oh come on – the Tories were in office for a lot longer overall
Get real
You could equally and with far more justification say that Labour ALWAYS inherit a public sector collapsing as a result of Tory government intentional mismanagement and have to set about addressing it. The NHS is a perfect example – you will note it is currently even worse than the usual Tory mess- but it appears they are no longer trying to hide their intention of ensuring “the UK cannot afford it” and so shifting the costs onto us all in the form of private insurance- which, to add insult to injury, is then taxed!
Labour have also always faced an extremely hostile finance sector oncoming into office, who do their best to undermine the pound whenever they take office.
Hi,
Just a quick point. I’ve seen some comments saying taking out extreme data points like after WWII and after the financial crisis. I can understand the statistical reasons for doing so but these events did happen in reality with a real impact on the economy and people. Taking them out sounds more like cherry picking and wishing away the financial crisis and WWII.
Agreed
The 70 year data is fine
The post 79 data is also fine
And the message is the same in both cases: Labour borrowed less and repaid more
The rest is, as you say, cherry picking
Cherry picking.
A polite term describing intellectual dishonesty.
Very interesting read, although I have thought this to be the case myself. What I dont get though, is why have nobody questioned them on this. All the times that Osborne and Cameron have talked about austerity and deficit, nobody have asked where the money they save have gone, as it most certainly have not been used to pay down the debts!
There is one thing though, that you have not put into the equation, and that is all the extra income they have had on sales of Government properties….. Thatcher sold of lots of things, and now the current Conmen (and women) are selling of the rest. This is money that are never mentioned, and nobody seem to have any idea what have happened to it. Both Thatcher and Camerons Governments have had wast extra income from all they sold of, which is yet another reason for no more austerity, AND no more borrowing.
I agree….may try and look at that
Really good, and important, piece Richard-thank you. Two (rhetorical!) questions spring to mind:-
Why didn’t anyone in the Labour Party think to do this work before the last election, indeed when the Coalition assumed office?
Is anyone on the Labour front bench now going to adopt it, use it, deploy it in argument, get it on the front page of a newspaper or two…or even print it off and hit Osborne round the ear with it this week?!
Meantime I’m going to print it off and pin copies around the house for guests to read!
I am kicking myself for not doing it before now
Don’t feel too bad about it – you might only changed the course of history…no big!
Exactly, both my partner and I were really disappointed we didn’t go down fighting. This is what we always thought to be the case but because we didn’t do the research or thought that we must be over simplifying things because the party didn’t say anything. Thank you for this Richard, have already share your link, unfortunately it’s only received 5 likes; unlike my friend’s post telling us what personality trait her name means. She’s up to 27 AND has comments!!
Probably because it’s a massively amateurish and factually meaningless bit of ‘research’ As someone before has mentioned Labour governments leave large deficits which mean subsequent governments have to borrow more whereas Tory governments don’t. In 97 the budget was moving into surplus, then, during the biggest boom in our history Labour contrived to create a 40b deficit pre-crash and 158b post-crash. Believing their own hubris and failing catastrophically to do what prudent governments should do: prepare for recessions after a decade of sustained boom.
If a government inherits a surplus budget it has to borrow zero over 5 years If a government inherits a budget deficit of 158billion – without a change in revenue or reduction in spending it would have to borrow 750b.
So tell me, how long woukd you like the lag to be after a labour government? Five years? More?
That seems to be your claim
Could it just be you want to deny any responsibility for Conservative borrowing and all credit for labour prudence by simply having me invert the results
Do you honestly think that man on the Clapham omnibus would believe that was in any way appropriate?
So why do you?
Thanks – interesting figures.
Could you please confirm whether PFI was counted or not, as whether it is in or out of public borrowing figures seems to vary by agency.
A second interesting comparison would be COST of debt + repayment, as a percentage of GDP.
Neither, of course has bearing on the secondary question, as to whether spending is stimulative or not…
PFI is not in but has been done by both parties pretty consistently: I do not have the data to add it in as yet but also think it will change little
Debt is not repaid: it is rolled over
So only interest matters: I may look at this
Excellent piece of work – and yet surely not that difficult to do, and which completely overturns a core Tory narrative. So as others are noting, why are the Opposition not using this and other data (eg on the NHS) to undermine the prevailing narrative and create an attractive alternative? I really despair of them
Meanwhile its more useful material to use when arguing with the Tory Taliban…
I admit I now ask why I never did it before
Richard, I have a strong suspicion that if you search academic journals you may find something similar, but I can’t recall anything recent (I think I may have seen something pre the 2010 election).
If I weren’t on a handover deadline for tomorrow I’d have a crack, but as things stand won’t have time to search until Thursday. Happy to do it though. Let me know.
I’ve seen research based on the US presidents and Democrat presidents fair much better on the economy than Republicans despite Republicans being, supposedly, the better party on the economy. That same research also did the UK and Canada (it wasn’t debt and borrowing they measured though) and the Conservatives came out on top BUT it was like 2.7% as opposed to 2.5% or something like that. The margin for error though was like +/- 0.3% so the result could quite easily be the other way round.
So this proves that the conservative party are the anti-austerity party then? 🙂
No
It proves they are not managing the economy in the way they say they do
No – Austerity is about cutting public services and welfare provision. The Tories are clearly doing this. Their justification for this is that it allows them to then borrow less. These statistics would appear to undermine that assertion.
Surely it begs the question that if they are not the party of Austerity and fiscal prudence then who is benefitting from their largesse? I’m sure we all know the answer to that already though.
I found this set of graphs, ONS derived, quite useful
http://www.economicshelp.org/blog/334/uk-economy/uk-national-debt/
A reminder of how debt as a proportion of GDP was lower during most of the last Labour government than the level they had inherited from the previous Tory government. And that despite the rebuilding of for example health and education, which the Tories had allowed to decay (anyone remember 18 month waiting lists for hip replacements?) It would be interesting to see the extent to which off-balance sheet borrowing through PFIs changes this
I like to answer arguments that attribute the increase in debt entirely to government ‘spending’, still denying the impact of the banks and the financial crash, by asking how they think the government managed to spend about 30% of GDP in 3 years flat (2008-2010) on hospitals, schools et al to increase the debt?!
An excellent piece of work, You have stated the FACTS, But so many replies from people who still refuse to believe the fact’s !
Well done Richard, thank you, very valuable work.
So actually,the Tories are the careless borrowers, and Labour prudent.
The perception is the opposite. Because the media are Tory, and both know how to convince, labour must find a way to be as convincing. The truth helps, but evidently is not sufficient. I remember when the parties had to fight to win the backing of the media; those were the days. I wish I knew how to demolish some of these Tory myths.
Any chance you can get this published in a national daily with the headline “SHOCK HORROR – TURNS OUT IT’S THE TORIES WOT ALWAYS BORROWS MOST, NOT LABOUR”?
Who knows…
Hi Richard,
Might I just skew this thread a little bit sideways, and ask a question aimed in a similar but slightly different direction..? I’m no financial expert; I have difficulty in balancing my household budget, let alone the UK’s, but here goes:
Accepting that Conservative governments borrow more, take longer to repay the loans, and repay over a longer period of time (which I assume means paying a greater amount of interest on the loan also), what happens to a large percentage of the money borrowed..?
We’re aware that Conservative governments by nature approve of “a light hand on the tiller” and smaller State intervention – particularly with this latest example prefering the involvement of private to public investment and control. With the exception of Osborneomics, Tory chancellors also like to be able to have a “war chest” prior to general elections, and generally are able to whistle up “sweeteners” prior to the event. Generally the amounts of tax relief offered to the masses are limited, however, in the cause of “sensibly frugal economics”. I admit that all Chancellors like to do this.
The Labour government has a different sentiment entirely, immersing itself in spend, spend, spend we are told. It also prefers a much larger State involvement in just about everything. I’m sure that you can see by now where I am leading, and here, finally, is my question: how can a Conservative government, frugal and financially cautious; immersed in the need for an extreme policy of austerity and the need to pay down national debt (quickly?) get itself into a hole the size of our current UK debt – when you’ve just provided us with the facts you have and nailed the lie that they “inherited it from Labour”..?
I’d love an answer if you can give it, Richard. And thank you for all of the above.
Let’s not beat around the bush: they simply spend more
Do they- or is it that they give more away to the rich in assorted tax cuts / breaks? Or is the give away in welfare for corporations and rage grouse moor landowners?
Large, not rage! sorry autocorrection gone mad again.
Tax breaks for various members of the rentier class. Housing benefit also goes up if they pursue policies which lead to inflated house prices in London (might be interesting to do an analysis on how the total housing benefit bill has varied with different governments, Richard?).
Spending on roads (often billions of pounds more per year), airports, etc.
“Investment boards” for local businesses. (I used to work for a medium-sized software company in Northern Ireland, and grants from the public-funded “Invest Northern Ireland” basically paid half the wage bill. I found that odd when we started bidding for government contracts. The “private sector” may be privately owned, but its salaries aren’t always privately paid for.)
I knocked up a quick spreadsheet of Public Sector Current Budget Deficit as a %ge of GDP and Public Sector Net Borrowing as a %ge of GDP (from 1956) last night. That allows looking at the difference between these 2 data series which reflects net public sector investment. I arrived at broadly similar results to yours.
I prefer the percentage of GDP to £ figures (deflated or otherwise) as it helps account for population growth which will magnify the effects of more recent years which we’d expect to have higher populations and therefore higher spending, taxes and deficits.
I suspected a pre/post 1974 (oil crisis and gold standard) might be a factor but the trend of higher Conservative PSCBD and PSNB was still present. A long term trend of rising PSCBD seems apparent whoever is in power. Interestingly the Conservatives invested more on average than Labour too which undermines a common perception that it’s Labour that invest in infrastructure. That said a trend of declining investment over the period is apparent reflecting post WW2 reconstruction efforts.
All interesting stuff. Unfortunately I have a heavy schedule of homework and exams through to June and haven’t learned to navigate the ONS site to dig up data yet to do a more thorough job myself.
Comparing variation against longer term regression trends, international comparisons and inclusion of other variables might shed more light. Thanks Richard.
However, our current government isn’t *spending* this borrowed cash, but giving it to hoarders. Isn’t that what matters? Unfortunately, I do hear Labour being criticised for spending pretty often. It’s there that it starts to complicate in most people’s minds.
Hi Richard, first of all this is a great analysis that I think everybody who plans to step into a voting booth in the future should read.
Here’s my thought on why this misperception is so widely believed, and I’m not endorsing this but merely observing aloud on how members of the electorate think. From your figures, up until 2008 Labour had borrowed 461.6b in 2014 prices, but then in the two and bit years from 2008 to the 2010 GE Labour borrowed 287.6b in 2014 prices. So over their preceding 26 years in office they borrowed on average 17.8b per year, and then from 08-10 they borrowed on average 143.8b per year (again all in 2014 prices). I think it’s probably true that when many people turnout to vote they assess what happened more recently, so they are more concerned with Labour’s massive amount of borrowing in 2008-10, then say, how much they borrowed in Attlee’s government 70 years ago. Even to a lesser extreme, they might be more concerned with the Brown years than the Blair years.
And between 2008-2010 Labour borrowed 287.6b, that is something the Conservatives can use as ammunition. Again I’m not saying rightly or wrongly, because there was a global economic crisis and that can be and is Labour’s defence. But it at least explains the narrative a bit more to me. But that’s just the first part of it, the “Labour borrow too much and are bad with the economy” half. The second half is that “we, the Conservatives, don’t borrow too much and are good with the economy”. But the trend of massive borrowing since 2008 has continued with the Conservatives, who have borrowed nearly as much on average as Labour did since the 2008 crash, and over a longer period of time. I can’t figure out at all why people accept that second half of the narrative.
I am not for a moment disputing the validity of what you say
But go right back to the begining of why I did this: three radio presenters on two channels told me Labour always borrow more
So went to bother to check if that was the case, and it is not
That’s all I did: I proved the broad perception – which one presenter had said his granny had told him – is just wrong
Sure. Perhaps I’m being too lenient on people who simply have the wrong facts, which when you’re debate influencer like a radio presenter can be dangerous.
Now we have this analysis and this perception can be proved to be wrong, I hope it will be challenged more and we start to examine why it has perpetuated so strongly.
That’s an unfair comparison. Labour probably borrowed that to bail the banks out. I believe Osbourne has borrowed £500b since 2010 and nobody questions that.
Like I said Scott I wasn’t endorsing that view, just noting that this is where the perception may stem from.
Just to say that Blairs Labour Party were a soft Tory/thatheritescany way so include that data.
I’m a very simple soul and don’t pretend to be as clever as you guys but one question keeps bothering me. If the Tories are borrowing so much money and making cuts to everything, WHERE THE HELL IS ALL THE MONEY?
Spent
The worrying this is what have they spent the money on? I’m definitely not an economist and don’t pretend to be…..
Why do you think the rich are getting richer Sue?
Borrow from the rich and pay them interest, reduce taxes for the rich to make sure they vote for you, bail out the rich when they get in trouble, print money for rich via QE when all else fails.
At the same time cut wages and benefits for the poor, cut benefits for the unemployed, sick and disabled, cut public services and replace with private services, etc etc etc.
That’s what you get with a Tory government!
no one is cutting wages.
When you consider that the Conservatives have consistently boosted income and supposedly simultaneously reduced debt burden by massive privatisation sell offs the data is even more damning, what did they do with the money, they gave it away to their rich buddies!
I appreciate the work that has gone into your research and commend you for it. I will not argue with your numbers, but in my view whether Labour or the Conservatives borrowed more is irrelevant. What ought to matter to people is either where the money came from to pay down debt, or where the money from increased debt went to. In other words, of the money taken from you and me, did the Conservatives or Labour use it more wisely? I guess this means trying to quantify whether our net wealth went up or down under their respective governances. Another question worth asking might be not which borrowed more, but which borrowed more prudently, since it is not just how much you borrow but how much you will eventually have to pay back that matters.
Finally, I personally never liked the concept of ‘public sector borrowing requirement’. Any chancellor that builds in a requirement to borrow every year cannot at the same time be prudent – I just can’t reconcile the two things.
If the public sector doe3s not borrow there is no money, literally
How then might you run the economy?
A chancellor has a duty to create the money the economy needs – and borrowing does that
Great article Richard, both informative and enlightening. My admittedly simplistic take is Conservatives believe borrowing (Labour) is bad. However if no one borrowed to invest no one would have a mortgage or business. Labour borrow, invest and generate revenue. Conservatives cut and revenue falls so borrow more. It’s all rather obvious and its a shame that “impartial” outlets such as the BBC stifle differing perspectives. The failure of austerity and its impact in missing targets, failing standards in public sevices etc does not get the negative scrutiny that Labours economic policies do.
In reply to Richard Murphy, you can raise it through taxation or, if your central bank is not independent, you can just print it, or you can sell assets, or you can steal it; there are many alternatives to borrowing. Not advocating one or snother, just saying …
This is a weird question, but do you have the full data table for the pre-crash spending at 2014 prices available? I’d like to make a graph of this so it’s more easily digestible for social media if that’s OK.
Sorry: I don’t
This is fascinating stuff. As others have hinted at, could it be that there are previous “crises” that we don’t remember which have skewed the overall data? It would be very interesting to see year-by-year figures in order to counter that argument.
The data sources are all listed – look at the House of Commins Library data
But you miss the point : the issue is the aggregate, not the particular
And I am sure post WW2 history is plenty well enough known for nothing to be hidden
Richard
Thank you for all you efforts in producing the data about.
The Conservatives have been the biggest borrowers over the last 70 years
I am no so adversed as yourself and your followers in tax and finance and hope that i do not seem lacking in understanding but i would like to understand the following:
Is the closing deficit from the vacating government the same as the opening deficit of the incoming government?
What is the deficit balance made up of?
Who are our creditors?
Why is it increasing when we are selling off assets, making vast austerity cuts and record fines to companies (where do these fines go?)
Thank you for your time and efforts and the all the charts following the original article
Rod
Is the closing deficit from the vacating government the same as the opening deficit of the incoming government?
Yes
What is the deficit balance made up of?
Government bonds
Who are our creditors?
Very largely pension funds, insurance companies and banks. 70% are in the UK. The private pension system would collapse without this debt
Why is it increasing when we are selling off assets, making vast austerity cuts and record fines to companies (where do these fines go?)
Debt is increasing because our income is not increasing as much as demand for services and because the government is refusing to spend – preferring to keep people under employed and unemployed. The record fines are overall small – most go to the Treasury in the end
Sorry forgot to tick box to be notified about post
I’m definitely not a Tory, however how much of the initial borrowing can be attributed to post war rebuild? Also people need to stop being idiots and realise it was a GLOBAL economic crisis which was triggered by the US housing market collapse, not contained or set off within the United Kingdom
I eliminated everything pre 1979 in another blog and it made no difference to the findings
Adolf Hitler in Mein Kampf, (and I’m not saying he was original in his writings)
“If you tell a big enough lie and tell it frequently enough, it will be believed.”.
This data is a real surprise to me, and my own political views are definitely left-of-centre. It’s counter-intuitive and totally contradicts the popular image the conservatives project of themselves of being more fiscally responsible than Labour.
I’d be quite interested in the figures for government debt with the proceeds of the sale of large public assets taken out. Can you dig those out from the sources you’ve got?
I have done that – look at later blogs
As you only have the GDP Deflators from 1955 why not exclude the years before that? This also allows the country 10 years to recover from WWII and makes your data more accurate/relevant. You also can’t use the figures for 2015/16 as they are below the dotted line and are projected and hence not accurate. If you redo your figures from 1955 and also split the Debt pro rata for years when there was a change of power then the figures change a bit. Converting everything to 2014 prices, for 1955-2015 you end up with a yearly average for Labour of £33.38 billion and for the Conservatives (I think we can safely class the coalition as Conservative) £35.68 billion. So not masses in it but the Conservatives are still ahead. If you look at 1955 to 2008 then you end up with £22.17 billion per year under Labour and £22.86 billion per year under the Conservatives. So even closer but again still with the Conservatives borrowing more.
However, you can completely skew these figures by using the change of power in 2010 as the end date. After all, why should the Labour party be allowed to ignore 2 years of high borrowing to clear up their own mess? In all honesty it was a global problem but if you are going to use the “that’s what the conservatives would claim” argument then why not go the whole hog? This leaves the Conservative yearly average at £22.86 billion but raises the Labour borrowing to the original £33.38 billion per year clearly showing Labour borrow more. You could even blame Labour for a good chunk of the borrowing during the coalition to skew the figures even more (or just blame the Lib Dems.) as the borrowing for that period was £113.30 billion per year!
So, which figures do you go with? I guess it depends on your political allegiance. Personally, from these figures I would say it’s pretty close with the Conservatives borrowing a little more.
If the prediction figures from the Government borrowing briefing paper are to be believed and using the figures up to the end of 2019/2020 as an election should be due around then, then the Conservatives will drop to £30.60 billion average per year since 1955, so below Labour for that period. But I guess we can really take those figures with a pinch of salt and they are currently irrelevant anyway.
Ignore the last paragraph as the figures are wrong and should be £33.88 billion per year average under the Conservatives so closing the gap but still not quite there. This is assuming 2% inflation per year over that period although that doesn’t make masses of difference to the figures.
I have undertaken a rather more reliable method than you suggest to synthesise the data
And nothing changes the conclusion
So you are clutching at straws
I did knock out the first eight years to match the last eight at one person’s request
It was spurious thinking, but just for the record, it changed nothing
And I have shown what happens when eight years are taken out
I would never use 2010: that is a wholly spurious cut off date and you show your bias when suggesting it: Labour did not create a mess, as a matter of fact. But if we cut out this whole disputed period we still end up with the same conclusions, as I have noted
“So you are clutching at straws”? Really? When my figures actually back up what you are saying?
I also agree you shouldn’t use up to 2010 which is why I said “you can COMPLETELY SKEW these figures by using the change of power in 2010 as the end date”. All I have done is recalculated the figures based on the sources you were using. It is still only a rough calculation as I have attributed any borrowing pro-rata during a split year which would not be accurate. For example, would a party fighting to stay in power borrow more to try to make it look like they were doing better than they really were? The figures wouldn’t come out until way after the election so why not? I was trying to see where the statement has come from and what arguments you could “make up” to back it up. Likewise the bit about blaming Labour for the borrowing during the coalition.
Did the world end in 2010?
Why didn’t anyone tell me?
And please do remember Osborne said he could and would eliminate borrowing by 2015. If he has not then he must be responsible
This article is interesting as it relates to a GLOBAL FINANCIAL crisis rather than LOCAL LABOUR crisis.
To quote “Mr Darling’s most striking answer was the “absolute astonishment” he felt when he asked Britain’s largest banks to account for the risks contained in their businesses – and they were unable to come up with a coherent answer.
This total lack of knowledge – coupled with the hubris of profit-taking built on lax credit – went to the heart of the financial crisis.”
http://www.bbc.co.uk/news/business-29982178
For someone who was apparently “the 7th most influential person in global tax in 2013” you are really being rather childish.
Who said anything about the world ending in 2010? Again I was agreeing that you shouldn’t use those dates as it was a global problem and not just the UK.
“I have undertaken a rather more reliable method than you suggest to synthesise the data” – then please state your sources properly. You have stated where you got the figures and the GDP Deflators from and then estimated the rest. According to your blog you have guestimated the GDP factors prior to 1955 and you have given all the borrowing and power in any year to the party in power longest that year. If that is not the case then why state it? If it is then I suggest your “more reliable method” actually isn’t.
I have made my data abundantly clear
Estimating missing data is a wholly normal statistical method
And I have been clear on how I have attributed parties to years
All totally common sense, straightforward, unburnished and appropriate
But you don’t like it
Why?
This got me wondering as to where the belief that Labour borrows more than the Conservatives comes from and generally playing with the figures a little (after all politicians tend to do that). If you remove the interest paid from the amount borrowed each year, which kind of makes sense as some of the amount borrowed is due to paying for previous borrowing, then you can back up this statement.
Adjusted to 2014 prices and averaged per year we get:
For 1955-2015: Labour £5.52 billion, Conservatives £5.03 billion
For 1955-2008: Labour -£4.38 billion, Conservatives -£4.84 billion
For 1955-2010: Labour £5.52 billion, Conservatives -£4.84 billion
So, up until 2008 we had borrowed way LESS than we had paid in interest when the figures are adjusted to 2014 prices! This I would guess is due to initially still paying off debts from WWII and then Maggie selling off everything she could!
This also shows that the main periods since 1955 where we have borrowed more than the interest we paid were during the 70s under Labour (probably where the statement comes from), under John Major (obviously not Labour) and from 2008 onwards.
Why not eliminate any arbitrary variable sum you like to get the answer you desire?
Alternatively, shall we use the data to test the actual hypothesis I was exploring?
I did and it showed what you were stating. You have redone these figures in another blog from 1979 – that’s rather convenient isn’t it! Let’s get rid of the period that probably resulted in the statement in the first place, i.e. when Labour was borrowing the most.
The above, removing the interest, was more to show how much the mounting debt was costing us prior to 2008. I even stated a lot of the debt was during John Major’s terms and that Maggie only looks good as she privatised everything.
But, no, because I don’t 100% agree with the figures you have used, despite giving you the same result, you feel the need to go all “Labour” on me! Wow!
I’m not going anything on you
I am simply saying that you are demanding data changes that appear to make no sense at all and I suspect an ulterior motive that I have not got
And why 1979? Because it was the shift from the post-war consensus of Keynesianism to the neoliberal era
Everything I have done is logical. And this debate is over
“And this debate is over”! – OK 🙂
much more informative. Let’s take into account that employment is up and inflation is low under this government.
Much of that employment is decidedly marginal at best
And they are massively missing their inflation target
An important piece of work. Thank you for having the initiative and taking the time to do it.
It’s curious to see some trying to pin the high borrowing levels since 2010 on Labour, when the Conservatives would not have regulated the financial sector any more tightly if they had been in power in the previous decade; if anything, they advocated an even lighter touch when in opposition.