I have written extensively on the 50p tax rate and came up with the biggest estimate published on how much the Revenue would raise from it - based wholly on their own figures. That figure was a sum of more than £6 billion.
Now we know the government, HMRC and the Office for Budget Responsibility do not agree. So why is that?
Well, let's look at the reconciliation table published by the OBR, which looks like this:
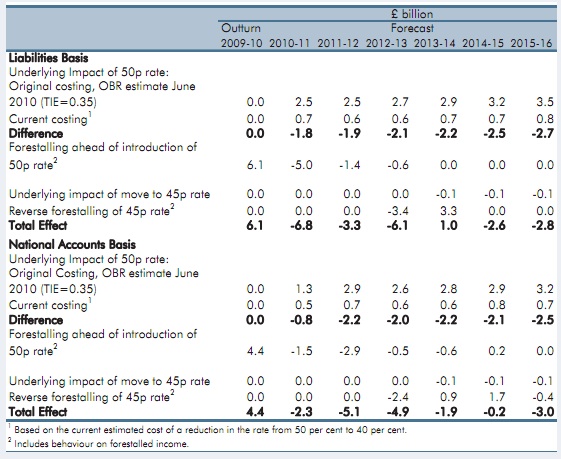
So what we learn is that the effect of the tax in 2010/11 was negative - but only because £6.1 billion it may have raised in 2010/11 and after was shifted into the previous year, for reasons Channel 4 have explained.. £5 billion of that was lost in 2010/11. So but for that shifting the tax would have raised the £0.7 billion they say it did raise (which, by the way, out of more than £40 billion paid by those with income over £150,000 is an impossibly small ratio) plus £5 billion. Or £5.7 billion in all, at least.
The shifting could not have happened again in 2011/12 - the year for which I prepared my estimate. That would be impossible. The tax could not have been introduced twice! Despite that the yield is actually assumed to go down in 2011/12 - something that seems so implausible that no reasonable basis it could possible be constructed. In that case let's dismiss this forecast as a fabrication and stick to the 2010/11 data of what should be now known tax collected plus tax known to be avoided on a one off basis and the revenue but for that one off avoidance would have been £5.7 billion in a year when I forecast it would be between £5 and £6 billion.
In other words, this data looks to confirm all I said and confirms I was right, here.
It also confirms that these forecasts are now simply a matter of make believe. And that is confirmed in the OBR report where they say:
The assumption that the behavioural response to the 50 per cent rate is more powerful than the original costings assumed means that the cut to 45 per cent appears less expensive than it would have done under the original assumptions.
In other words now there are Laffer curve fans in charge it's assumed that this tax collects no revenue. That's not fact. That's assumption and nothing more. Or the lies restatements that I suggested would be made.
Sticking to the facts it should have raised £5.7 billion in 2010/11 which is consistent with my estimate of £6.7 bn in 2011/12 and I therefore maintain my figures to be right and that my estimate of the loss from introducing the 45p tax rate - which will be about £3 billion - is also right.
Which also means that the abolition of this tax rate is a straightforward gift to the rich - as I always predicted it would be.
Thanks for reading this post.
You can share this post on social media of your choice by clicking these icons:
You can subscribe to this blog's daily email here.
And if you would like to support this blog you can, here:


[…] company £800 million they were already getting. And although he says otherwise, the 45p tax rate is a massive tax giveaway to 300,000 in the […]
The table says that the “underlying impact” of the 50p rate for 2010-11 was to raise £0.7bn. However, forestalling took £5bn off this, giving an effect for the year of minus £4.3bn, which is £6.8bn worse than the original estimate of £2.5bn.
You’ve wrongly added the £5bn into a number which already has the £5bn added in.
The OBR report explains that, in the light of tax data received, they’ve revived their original elasticity estimate of 0.35 to 0.45, which is why the underlying number has changed. It’s difficult to distinguish over one year between forestalling and elasticity effects, so they are not very confident.
Meanwhile you continue to insist, in defiance of all economic research and based on polemic rather than evidence, that taxable income elasticity is zero.
Respectfully – to get that result the tax in effect raised nothing
Are you really saying that?
And you want to be taken seriously?
Seriously?
Because that’s just not plausible.
Explain to me how on the basis of the total income of the top 1% of the population just £0.7 bn could have been raised
Go on – show me the maths
That will be a pleasure. You’ll note that what I said in my previous comment was first that you’ve misread the OBR table and second that elasticity should not be ignored. I can’t comment in detail on the OBR’s elasticity calculation because I haven’t got their data. But I’m happy to outline for you how you can get an estimate of the effect.
We’ll follow the approach in this paper by Diamond and Saez, which you referred to in December. We assume that incomes above 150k, and somewhat below it, follow a Pareto distribution with power ‘a’. And we assume that income follows an elasticity relationship to one minus the marginal tax rate, with elasticity ‘e’. The OBR report tells us on p109 that they’ve estimated e=0.45 .
Call the bottom of the top band z*, z*=150k. The Pareto distribution implies that for an income z in the band the density of taxpayers goes as 1/z^(a+1). To get N taxpayers in the band we need the density to be Naz*^a /z^(a+1) (by integration). The average income in the band (again by integration) is z*a/(a-1).
The tax paid in the band at rate r is therefore Nrz*(a/(a-1)-1) = Nrz*/(a-1).
We now shift the tax rate to r’. The elasticity relationship tells us that this shifts an income z to z’ = z((1-r’)/(1-r))^e. To make the next bit more readable I’ll write this as z’ = zf. The density now becomes Naz*^a f^a/z’^(a+1). The average income in the band is unchanged, but the number in the band is Nf^a, so the tax paid is Nf^a.r’
Substituting back in, tax paid = Nr’z*/(a-1) ((1-r’)/(1-r))^(ea).
You can differentiate this with respect to r’ to find that the tax-maximizing rate is given by r’ = 1/(ea+1), as in the Diamond & Saez paper.
Putting in some numbers for 2010-11, we have N = 275k, average total income = 342k, which I’ll assume is also the average income net of reliefs. That gives a = 1.78. Putting those numbers into Nrz*/(a-1) gives tax paid at the 50% rate of 26.4bn (so if you assume zero elasticity, the cost of a 10% cut would be 5.3bn). Now putting r’ =0.4 into the big formula, with e=0.45, we get tax paid on earnings above 150k at the 40% rate = 24.5bn. So the cost of a 10% cut would be just less than 2bn.
One problem with this analysis is that it assumes a Pareto distribution down to incomes below £150k. Diamond & Saez tell us that Pareto is a good fit in the USA down to $300k, so this is stretching things somewhat. The OBR will have actual data for the shape of the distribution around £150k, so they will have been able to do a more accurate analysis by working with the actual distribution rather than a simple parametric representation of it. I expect this to be the reason why they get £0.7bn rather than my £2bn. As I said, I can’t comment on the quality of their work. But I can endorse the conclusion that elasticity effects can run into billions of pounds.
No, that’s not what I asked for
That’s just the crap taught in our universities based on ideas like perfect information and wholly retinal people – all of which show economists come from another planet with no idea of the human condition
Now just take the data I have used and show how the arithmetic of a payment of just £100 million could result from the known income distribution once the transitional effect is taken out of account.
If you can’t do that using known tax reliefs then your argument counts for nought
Sorry, I thought you wanted to be shown some relevant maths. I thought you’d particularly like the Diamond & Saez analysis since you’d endorsed it yourself. “I buy that: it accords with the world as I observe it”.
No one denies that if taxable income elasticity were zero, the 50% tax would raise much more money, somewhere in the region of £6bn if HMRC projections are correct. But no economist thinks that elasticity is zero.
Let’s go back to the OBR figures you reproduced above. They show that back in June 2010 the OBR estimated the tax would raise an additional £2.5bn in 2010-11 – the OBR did not think elasticity would be zero. They show that the data from tax returns (which should be almost complete by now) give a shortfall from that estimate of £6.8bn. We can deduce (they don’t say) that the observed effect was a reduction in income of £4.3bn. The OBR thinks the contribution of forestalling to that was £5bn, so the 50% rate would have raised an additional £0.7bn in the absence of forestalling.
There’s no way to divide the shortfall exactly between forestalling and elasticity effects, so this number is not certain. But if elasticity were zero, as you say, the forestalling effect with have to be not £5bn but £10bn. And most of that would have shown up in tax revenues in 2009-10. As you can see, it’s not there.
You believe that taxable income elasticity is zero. The “crap taught in our universities” says that it isn’t. The economists I’ve cited say that it isn’t. All the data, including from UK tax returns, say that is isn’t.
It’s going to be hard to get your tax research taken seriously by people making decisions about taxation in the real world if you persist in ignoring real-world data.
You utterly ignore the point
The shortfall is due to the transition
Now explain how that could recur
And why in that case it would not raise the sum I’ve suggested
Please do what I asked
You see – I am dealing with the real world – and you’re saying a one off event will be replicated – but the tax won’t be introduced every year
That’s why I did my data on 2011/12 not 2010/11 – because I sought the real answers – not politics
The one-off event will not be replicated. The OBR estimates the forestalling effect for 2011-12 as £1.4bn, which is much smaller (but not zero).
Your problem is that for you to be right about zero elasticity the forestalling effect for 2010-11 would have to be £10bn. And plainly it isn’t. This is the point you have to address.
I’m talking about 2010-11 because that’s the latest year for which the OBR has got fairly complete tax return data.
And therefore you are wholly missing the point – and deliberately so
You cannot suggest how £6.7 billion of tax – reasonably forecast by HMRC to be collected – could not have been collected. You just offer a crass technical analysis that would appeal to an economist – but as we all know, they live on another planet.
Show me how it was possible in 2011/12 that this income did not arise – explaining how it occurred is what I asked and you have not
In that case I conclude you’re out of your depth here and bid you adieu
Please go back to your blackboard and let those of us with real world experience deal with reality
The point where I smell a very large rat on all of this is with regard to the “astonishing” £16bn that George says was brought forward for inclusion in 2010/11 tax returns so as to avoid the higher rate, and on which even more surprisingly a mere £1bn of tax was raised.
First of all I am not sure what mechanism is used by these people to accelerate the recognition of income – deferring on such a scale I can understand, but bringing forward would appear to be much more difficult given that it would seem to go against what the FSA Corporate Governance Code and good corporate governance requires. And secondly, I would like to know how that £16bn was distinguished from the that income that was defererred from 2009/10 to avoid Labour’s bank bonus tax – which anyone looking at the Bank’s remuneration notes can clearly see was happening as well.
It is funny how the Govt seems to assume that all the avoidance was in respect of the 50p rate and couldn’t possibly be attributable to other causes. On the other hand it is not so funny how the Government thinks grannies should pay more tax as a result of it allowing high rate payers to get away with tax avoidance on such a scale which they then reward with a tax cut.
Spot on
Richard, on this Paul is correct, I’m afraid. The underlying impact shows the tax only raising £0.7bn against the OBR’s original estimate of £2.5bn, a difference of £1.8bn. But both those figures assume zero forestalling – obviously, because the original estimate was a long-term estimate, so must exclude short-term and one-off effects, and the £0.7 is a comparable measure. When you add in the OBR’s forestalling estimate of £5bn, you get a net loss of £4.3bn, and the shortfall against the original estimate becomes £6.8bn. So with zero forestalling, the OBR estimates the tax would only have raised £0.7 bn. To reach £5.7bn, as you suggest, there would have to be forestalling of £10bn.
I don’t know why the OBR’s estimate of the tax take excluding forestalling is so low. But it does suggest that it is very easy for high net worth individuals to avoid tax. The 50p rate should have raised a lot more – as the OBR’s original estimates suggest. That it apparently falls so far short of expectations even after eliminating forestalling indicates that people have also found other ways of reducing or hiding their income. Some of those will of course be completely legitimate – such as spending more time on the golf course. But I don’t think that reducing the rate is a reasonable response to widespread avoidance of a higher rate. The obvious thing to do is to reduce avoidance, by closing loopholes and clamping down on the use of service companies and offshoring. This is what you are campaigning for, no?
I’m aware that the spambox looms, but this is not intended as a spam comment. It’s just that this time your maths was a bit astray – happens to us all at times – and actually I think the OBR’s figures support your case for tax reform rather better.
Sorry – that’s wrong – it’s very clear from IFS work that the tax without avoidance would have raised as much or more than I suggested
Look at their data -t supports my position
As for the claim of a 0.48 attrition – that’s not proved anywhere – and the fact HMRC and IFS agree simply says they use the same flawed model. This, bar forestalling, says their assumption is attrition, not that behaviour is attritional
I genuinely disagree with you because your claim is not supported by facts
And forestalling was only year one – and I estimated year 2 where therefore my forecast remains on the button as it was only forestalling that made the difference
So respectfully I remain right in my opinion
I have used facts and known income distributions that would be hard contractually in many cases to disturb after year 1. IFS and HMRC make wild assumptions and forestalling – that’s make believe
Richard, I don’ t think we are disagreeing, actually. Of course the tax take without avoidance would be much higher. The £0.7bn isn’t a “zero avoidance” figure – only forestalling is separated out. What the OBR figures seem to show is that forestalling alone isn’t enough to explain the reduced tax take in relation to their original estimates: there seems to be other behavioural change and/or avoidance going on too. The IFS do warn that the model is imprecise, and I know Howard Reed has suggested that 0.48 is too high, so it may be that the OBR figures are lower than they should be, though it is difficult to know how far out they are. And I know you are estimating 2011-12 figures. I’m just concerned that the jump from minus £4.3bn (including forestalling) in 2010-11 to estimated £6.7bn (without forestalling) in 2011-12 seems huge if forestalling is only £5bn as the OBR suggest.
But what else are they doing?
And if we assume rational players, why are they doing it?
Clearly, the OBR is about as independent of Osborne as Cameron is of News International. As much as I always suspected that the figures would be presented to support the argument, I hadn’t thought it could be quite so blatant.
They can only get away with this because the media allow them to. It was very interesting to hear the BBC woman (can’t remember her name and can’t be bothered to look up the name of such a biased commentator) semi-acknowledge the sleight of hand and then say that it rendered further discussion/resistance in the future irrelevant.
I know you don’t need me to say keep up the fight – but please do.
54 years ago today it was what I now think I was born to do!
And no I won’t be giving up!
My wife fears I will blog as my last act on earth
The other thing that is interesting is how in previous budgets the Govt and especially the LibDems placed great importance on the impact of tax and benefit changes not being regressive – but this was largely attributable to the effect of collecting c£3bn from the 50p rate. Now however the failure to collect that tax is ignored for the purpose of assessing whether the Condems tax/benefit changes are regressive – and the analysis in the Budget Report is just based on looking at the impact on 2013/14 in isolation, with the base assumption that the 50p rate will fail to be collected. The OBR should be ashamed of itself in allowing the impact on income distribution to be presented in such a manner. One of the basic tenet of good statistics is consistency of presentation.
I look forward to the IFS presenting an analysis of all the announced changes since this shower came to power – but I can pretty much guess what it will say if you replace £3bn raised by the 50p rate with the paltry £500m to be raised by the replacement measures announced today.
Indeed – that will be interesting