Following discussion on tax and GDP over the last day or so (see here and here) Prof Charles Adams of Durham University has done some more research, linked aggregate tax rates and the UN inequality adjusted human development index. As he has noted:
Using the inequality adjusted human development index (IHDI) as opposed to the HDI does not make much difference.
The same Heritage Foundation (2015) data has been used for the tax base.
The UN IHDI data for 2012 has been used as I wanted to include China and India.
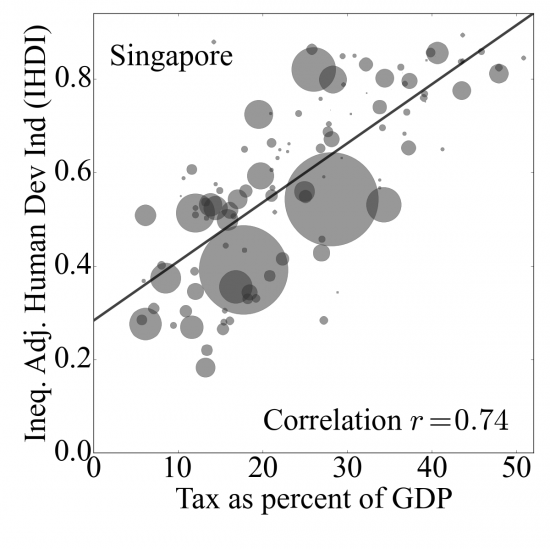
In both cases there is a very strong correlation (only exception is Singapore and as we know that in fact Singapore's exceptionalism is built on state funded housing and transport, and geographical factors).
This is the chart of the findings:
Thanks for reading this post.
You can share this post on social media of your choice by clicking these icons:
There are links to this blog's glossary in the above post that explain technical terms used in it. Follow them for more explanations.
You can subscribe to this blog's daily email here.
And if you would like to support this blog you can, here:

 Buy me a coffee!

Well done Charles. This is much tighter and though by eyeball I was unsure about the GDP vs Tax graph this one looks statistically significant to a very high degree; indeed I suspect there is a near certainty of a correlation. Might be worth checking the literature; not my area but might be worth writing up as a paper?
I suspect Alex Cobham and John Christensen at TJN are obvious partners
This is really interesting Richard and well presented.
Could I ask, do these graphs show which variable leads? Can you increase a low HDI by increasing taxation on those people, or does the increased HDI give an economy that can sustain higher taxation as reward for what the government has done?
Yesterday, the Prime Minister was advocating the Conservatives as the party of low tax and hence low human development. Is that what people really want?
A few extra details for completeness:
I should have said that I used HDI for Singapore as a IHDI has not been calculated. All others are IHDIs. All IHDIs tend to be lower by about 0.05-0.12.
If I exclude Singapore and update to all the latest IHDIs (2015) the correlation coefficient increases to 0.77 (from 0.74). If anything the correlation between tax and human development appears to grow over time, although I have not tested the statistical significance of this statement.
Thanks
It occurs to me that:
1) Longer life expectancy (higher IHDI), results in an aging population and requires increases in the level of taxation.
2) More years of education (higher IHDI), requires additional funding which requires increases in the level of taxation.
As such I would be astonished if there wasn’t a correlation.
Isn’t government spending included in the GDP figures ‘as is’ regardless of whether it added value?
So if a government worker (I am one) is paid £200 a day, it counts towards GDP whether she has a productive day, or whether she spends the day gazing out of the window.
Am not an expert in how GDP is compiled (did a quick read) so would welcome being corrected if I am wrong.
You are right
The weakness of GDP is it records what happens without in any way considering the value of the activity