
The background
I wrote yesterday about the absurd, and wholly inappropriate, focus on what politicians call welfare costs, and which I call social security, on which issue it is as if they are all united in the single goal of victimising those most in need in the UK.
As a result, I decided to explore these costs over time, with the help of Claude AI. The approach used is noted in a methodology note at the bottom of this blog. The data sources are reliable.
The data considered cover social security spending in Great Britain from 1948/49, the first year of the post-war welfare state, to the government's forecast for 2030/31. The costs are shown as:
- a share of national income (GDP),
- a share of all government spending,
- and in cash.
Every benefit in the official tables is placed in one of six groups, so nothing is counted twice and nothing is left out. I provide detail on this below.
Conclusions to draw from this data
I prepared the charts I reproduce below for one reason. I wanted to examine the claim that social security spending in the UK is now running out of control.
The charts clearly demonstrate one thing, which is that this claim is total nonsense.
That is true for recent history, and it is also true for projected spending.
The spending patterns in both cases are entirely consistent with recent expenditure profiles, and in some cases with those of Conservative governments going back to the Thatcher era.
Actual spending now, and that forecast, is lower than that spent as a percentage of GDP from the early 1990s to the late 2010s.
The conclusion is slightly different with regard to the proportion of GDP, but again the current expenditure, and that forecast, is neither exceptional nor without precedent in a time of need, which this moment very clearly is.
In that case, claiming now that social security expenditure is out of control is either to make a claim that is grossly inaccurate or a deliberate misstatement of the truth.
There are other trends in the data which are also very important to note.
The first is the growing significance of pension payments within the total social security budget. As a consequence, no one could reduce government expenditure on social security in the UK without harming the well-being of at least some pensioners. Since the political possibility of imposing that harm seems to be very low, those making the claim must, once more, be either ignorant of the facts or be grossly, and maybe deliberately, misstating their position.
Other trends include:
- Significant reductions in support for those unemployed through no fault of their own,
- Reductions in support for children despite the supposed neoliberal belief in the virtues of the family, and
- Reductions in support for those on low incomes.
These trends are set to continue. The evidence is clear. Over the last 15 or so years, this country has become more discriminatory, prejudiced, and uncaring. Politicians have ceased to have any real interest in the well-being of anyone but, it would seem, the wealthy. The data makes that clear.
In contrast, landlords have received significant support through housing benefits.
This said, those with what are called disabilities have also required more support in a society increasingly designed to be alien to them. This trend is expected to continue. Until neoliberalism ceases to demand that everyone must be a standard unit of economic input into its systems of production, that is inevitable.
But what is most overwhelmingly clear from the data is politicians' incomprehension of numbers. They appear quite unable to differentiate growing levels of spending when denominated in pounds from real levels of expenditure when expressed as percentages of total national income or government expenditure.
Most politicians, and commentators on this issue, would appear to be entirely unable to distinguish these issues or to, as a consequence, appreciate that because of a growing population, at the same time as we have, as a consequence of deliberate government policy, inflation within our economy, the total expenditure on social security is inevitably rising.
Again, we are left with a choice. Either they cannot comprehend these issues, which would be an indication of very serious intellectual incapacity on the part of those governing our country if it were true, or they are deliberately using data with the intention of promoting harm to the most vulnerable members of our community who are, necessarily, entirely appropriately, and wholly justifiably dependent upon a state that we have all chosen should exist, not least to express our collective capacity to care.
The reality is that if we have a crisis of care in this country, it is that we have insufficient care, are doing too little to address it, and are leaving far too many people vulnerable as a result.
The crisis of care in this country is nothing like that which neoliberal politicians describe. In fact, they, and not the cost of social security, represent the threat that we face.
A data summary
In 2024/25, the latest year of outturn, social security cost £305bn. That was 10.4% of GDP and 23.6% of all government spending.
In 1948/49 it was 4.1% of GDP and 10.7% of government spending.
The peak share of GDP was 12.0% in 2012/13.
The peak share of government spending was 28.1% in 1996/97.
Pensions now take 47% of the total.
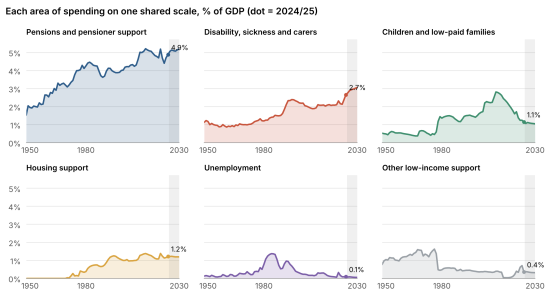
Spending on unemployment is 0.1% of GDP, against a peak of 1.4% in 1984/85.
Support for children and low-paid families peaked at 2.8% of GDP in 2009/10 and was 1.1% in 2024/25.
The cash cost of social security is forecast to reach £395bn in 2030/31.
The evidence
1 - Social security spending as a share of GDP
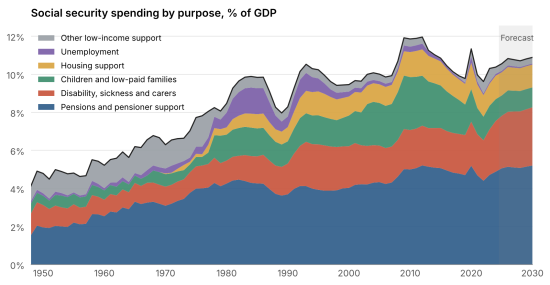
Source: DWP Benefit Expenditure and Caseload Tables (Spring Forecast 2026); OBR public finances databank. Great Britain social security spending. Shaded years are government forecasts.
2 - Social security spending as a share of all government spending

Source: DWP Benefit Expenditure and Caseload Tables (Spring Forecast 2026); OBR public finances databank. Great Britain social security spending. Shaded years are government forecasts.
3 - Social security spending in cash

Figures are in cash terms and are not adjusted for inflation.
4 - Each area of spending on its own, as a share of GDP
The same six groups drawn separately on one shared scale, so their sizes can be compared directly. The dot marks 2024/25.
5 - Support for children and low-paid families, as a share of GDP
In-work support for low-paid families runs from Family Income Supplement in 1971 through Family Credit, Working Families' Tax Credit and Child and Working Tax Credits to the child and childcare elements of Universal Credit.

6 - What is in each group
Pensions and pensioner support:
- State Pension (basic, graduated, SERPS/State Second Pension and the new State Pension),
- Pension Credit and its forerunners for pensioners (Supplementary Benefit for the over-60s and Income Support/Minimum Income Guarantee),
- Winter Fuel Payments, the Christmas Bonus, free TV licences for the over-75s, the Financial Assistance Scheme and one-off payments to the over-65s and over-70s.
Disability, sickness and carers:
- Sickness, Invalidity and Incapacity Benefit,
- Employment and Support Allowance,
- Severe Disablement Allowance,
- Attendance Allowance,
- Mobility Allowance,
- Disability Living Allowance,
- Personal Independence Payment,
- Carer's Allowance,
- Statutory Sick Pay,
- Industrial injuries benefits,
- War Pensions,
- the Independent Living Fund,
- Income Support paid to sick and disabled people and carers, and
- The health, carer and health-related standard allowance parts of Universal Credit.
Children and low-paid families:
- Family Allowance and Child Benefit,
- One Parent Benefit,
- Guardian's Allowance,
- Family Income Supplement,
- Family Credit,
- Earnings Top Up,
- Working Families' and Disabled Person's Tax Credits,
- Child and Working Tax Credits,
- The Universal Credit child, childcare and disabled-child elements,
- Income Support for lone parents,
- Maternity allowance, pay and grants, paternity pay,
- The Child Trust Fund and
- Tax-Free Childcare.
Housing support:
- Rent rebates and allowances,
- Housing Benefit,
- The Universal Credit housing element,
- Discretionary Housing Payments and
- Support for Mortgage Interest.
Unemployment:
- Unemployment Benefit,
- Jobseeker's Allowance,
- Supplementary Benefit and Income Support for unemployed people from 1978/79 to 1996/97,
- New Deal and other employment programme allowances, and
- The part of Universal Credit's basic allowance attributable to unemployment.
Other low-income support:
- National Assistance and Supplementary Benefit before 1978/79 (the official tables do not split it by claimant, and much of it went to pensioners),
- Other Income Support cases,
- Rate rebates and Council Tax Benefit up to 2012/13,
- The Social Fund,
- Cold weather and funeral payments,
- The cost-of-living payments of 2022/23 and 2023/24,
- The Household Support Fund,
- Bereavement benefits, and
- The rest of Universal Credit's basic allowance, mainly paid to people in low-paid work.
7 - Sources and method
Spending comes from the Department for Work and Pensions' Benefit Expenditure and Caseload Tables (Spring Forecast 2026). These cover every DWP benefit since 1948/49, plus the tax credits and Child Benefit paid by HMRC. The totals here agree with DWP's own published Great Britain total, including cost-of-living payments, in every year from 1978/79 to 2030/31, to within £0.3bn.
Coverage is Great Britain, because that is the only consistent series back to 1948. Northern Ireland's social security, now about £11bn a year, is excluded, so UK totals would be roughly 3% higher. The shares use UK GDP and UK total managed expenditure, as DWP does.
GDP and total managed expenditure for 1948/49 to 1977/78 come from the Office for Budget Responsibility's public finances databank (October 2026). From 1978/79 they are the figures in DWP's tables, which match the OBR's exactly where both exist. The years from 2025/26 to 2030/31 are forecasts consistent with the OBR's March 2026 Economic and Fiscal Outlook.
Universal Credit is split by its elements, which have been published since 2019/20. For 2013/14 to 2018/19 the 2019/20 mix is applied. Its remaining basic allowance is divided between unemployment and other low-income support in proportion to DWP's estimate of the Universal Credit linked to unemployment, which is the part outside the welfare cap.
Income Support is split by claimant group from 1978/79. Before then, it is shown as a whole under other low-income support, which understates the pensioner share in those years.
Not included are the furlough and self-employed income support schemes of 2020 to 2022, council tax reduction since 2013/14 (which is counted as local government spending), tax reliefs such as pension tax relief, and public service pensions.
Thanks for reading this post.
You can share this post on social media of your choice by clicking these icons:
There are links to this blog's glossary in the above post that explain technical terms used in it. Follow them for more explanations.
You can subscribe to this blog's daily email here.
And if you would like to support this blog you can, here:

 Buy me a coffee!


The current fuss about ‘welfare’ turns on disability related benefits which are part of a group that has recently been rising as a part of GDP and public expenditure. These are things where needs assessment is critical but the Tories undermined assessment quality to save money. Right wing parties demand targets for cuts which the Government has correctly refused to consider, especially as a review of assessment procedures and results is taking place alongside re-evaluation of most effective means of support for different disabilities. We’ll need to watch closely what they come up with, but they do seem to be aware that savings here can easily turn out to be additional costs somewhere else if support is not effective.
Labour is explicitly committed to neoliberal reforms to social security on this very issue, Tim.
Burnham has said no one under thirty should be on benefits.
You cannot anything but neoliberal and a total arsehole (a totally appropriate term in this context) to say that.
I despise the man precisely because he ho so hates so many people in this country that he could say something as callous as that. If you really think him suitable to be Prime Minister of the UK, you are seriously misguided, Tim.
I would not put him in charge of a school tuckshop. In fact, I would not let him near a school.