The myth
Dan Neidle is a corporate tax lawyer. I am told he tweeted this today (I can't tell, because he's blocked me):
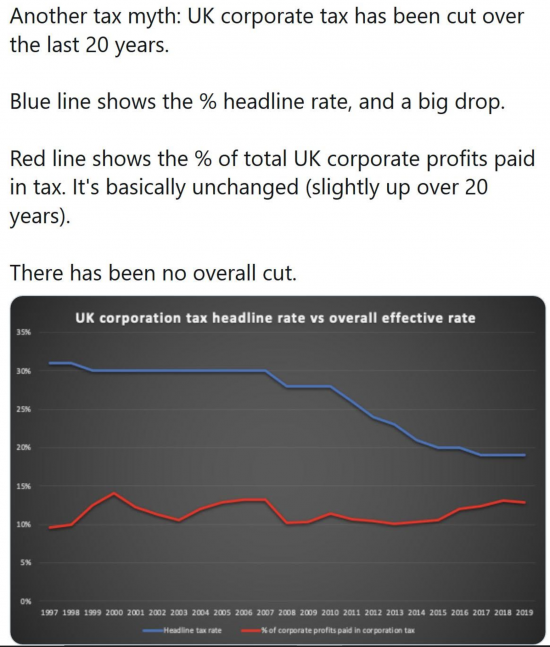
So the myth is that cutting the headline rate of corporation tax has not cut the overall rate of corporation tax paid in the UK.
Is it true?
It's only true that the rate of corporation tax paid in the UK has flatlined in proportion to profits if you completely ignore the fact that there are now three times more small companies in the UK than there were in 2000 - and they tend to pay higher proportions of their income in tax while their tax rate has hardly changed over the period.
The facts
The UK corporation tax rate has moved like this since 2000:
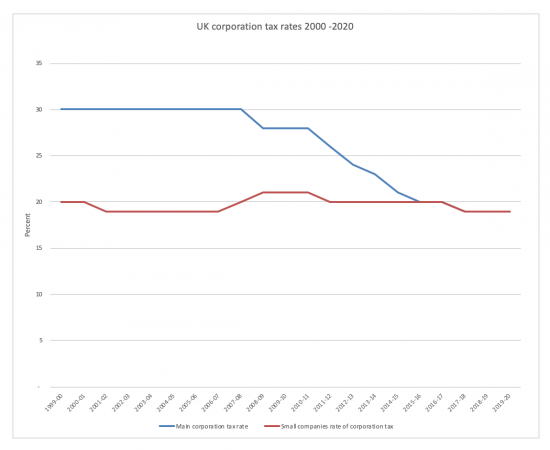
The boundary between taxpayers at the two rates is slightly complicated: in essence most companies with profits under £300,000 paid at the small companies rate: all companies now pay at the same rate. The vast majority of companies paid at the small companies rate. The fact that the apparent tax rate of UK companies has remained flat when the tax rate of the vast majority of them has been flat during the period is hardly surprising in that case. Data comes from various tax libraries.
The number of companies in the UK has risen dramatically since 2000:
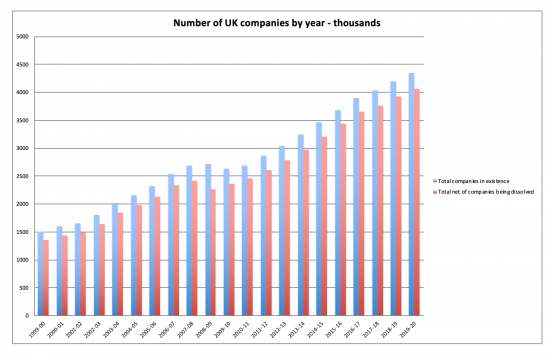
Data is all from Companies House, collected over many years. The number of companies has effectively tripled from 1.5 million to nearly 4.5 million in twenty years.
To put that in context the number of people for each company in the UK has fallen dramatically over the last twenty years:
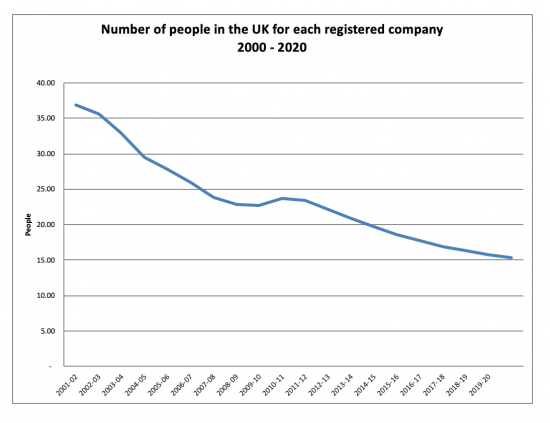
Population data was obtained from the Office for National Statistics.
In proportion to GDP each company could, if all GDP was attributable to corporate activity, have undertaken less of GDP in constant 2020 prices as a result:
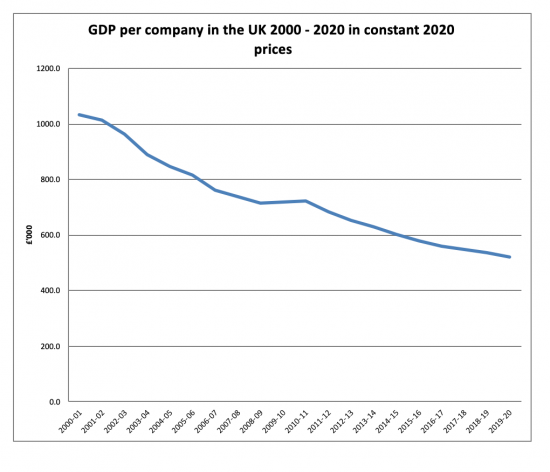
Each company may be smaller as a consequence: indeed, on average all most have been small, on average, based on this data. GDP data came from the Office for Budget Responsibility.
The amount of corporation tax paid by each company fell over the period in both original and 2020 prices:
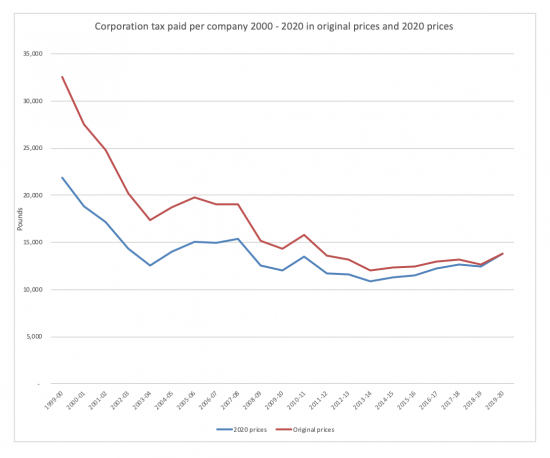
The decline per company was heavy until about 213 and then flatlined - just as rates were.
I had previously examined this trend in 2014 and found this data:
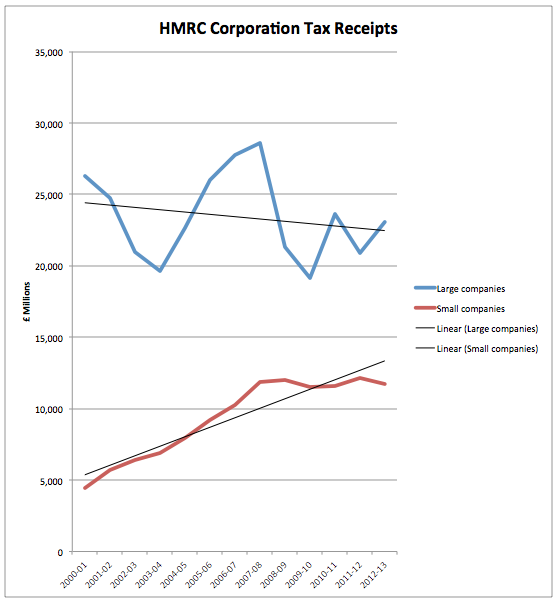
The reason why corporation tax revenues appeared to flatline as corporation tax rates fell was because there were so many more small companies paying a much increased overall proportion of corporation tax.
This is unsurprising. Small companies tend to have many fewer adjustments to their profit when determining the sum on which they pay tax - and on the whole tend to have net profit disallowances whereas large companies tend to have net profit reductions as a result of this process. The significant differences in the amount of capital allowances they claim largely explains this trend.
The apparent flatline in corporation tax paid as a proportion of profit does, then, result in the main from the considerable growth in the rise of the number of smaller companies in the UK massively distorting the data in their favour - and they have, indeed flatlined, as has their corporation tax rate.
The claimed conclusion is then the result of comparing data sources that are not comparable and not because of facts in the underlying data.
The real issue is quite different, and is what sum in income tax was lost because profits were diverted into corporation tax? And how much national insurance was lost on dividends paid to avoid that tax?
This myth sought answers to a question that was inappropriately posed.
Postscript on 29.5.20.
It's been put to me that this was not my best ever blog post. In fairness, I am going to agree: it wasn't.
First, an apology. Dan Neidle had not blocked me. I had muted him, which is something I almost never do. I had good reason to feel indifferent to his offerings, and maybe I should have stuck to them. But he had not blocked me. The lesson is learned: I'll stick to my decision on such things.
Second, let's be clear that Neidle only essentially argued with my reliance on a piece of work I had already noted I had not updated. I accept, maybe I should have updated that as well. But I rushed, having been asked to do a favour by writing this. The lesson is learned: don't rush.
That said Neidle claimed that he did extend my data. For the record, he didn't. He used a different time series. I do not think they're the same data. He should have reworked from scratch. Even then, the split between large and small companies is no longer available as the distinction has disappeared. I am not as convinced by his argument as he is.
And, peripherally, Neidle dismissed all claims re small companies by saying the IFS had only found £1 billion extra tax a year from these new small entities incorporating. That makes £1,000 each, approximately. I have not investigated the claim. But it seems wildly implausible. HMRC estimate the cost of small company incorporation net of the corporation tax that they pay at several times that sum. To expect that many small contracting companies pay £10,000 of corporation tax a year is also entirely reasonable or it would not be worth their while incorporating. That would, then, explain a significant part of the increase in tax paid outside banks in recent years. It's part of the reason why I suggest his data interpretations may be wrong. Much more work is needed on this to get it right.
Third, for reasons that are very hard to fathom Neidle seems to have included bank levies in the corporation tax take but they are not corporation tax, per se. That overstates his yield.
Fourth, Neidle used the ONS measure of corporate profits as his base for comparing tax payments to. And that makes no sense at all. This is a macroeconomic measure and not an accounting one. It is simply not suitable as an indicator of the profits on which corporation tax is paid, and is a real case of comparing apples and oranges. The two measure quite different things. The indicator has also changed over time, not least (as I believe I am right in recalling) with regard to how the profits of single person companies are viewed in the macro accounts. The claim made is inappropriate in that case without quite a lot of reworking to deliver consistency.
Fifth, Neidle also ignores deferred tax and changing tax bases. So, as my 2008 research for the TUC shorted, deferred tax owing skyrocketed in the period 2000 to 2008. Generous capital allowances, in particular, increased these balances. And then as the impact or recession and the changes in capital allowance rules impacted these deferred tax balances reversed, and in fact deferred tax assets became considerably more common as tax was being paid upfront. But Neidle ignores this and yet it may well explain most of the smoothed flow over time - precisely because that is what deferred tax accounting is intended to do.
And sixth, Neidle does still ignores the fact that for about 97% of companies the tax rate hardly varied over the period.
So do I agree his claim? No.
Do I regret engaging? Yes.
Will I do so again with a person only really interested in ad hominem attacks? No.
But should I have taken more time? Yes, because his claim really does look very wrong.
Lessons learned
Thanks for reading this post.
You can share this post on social media of your choice by clicking these icons:
You can subscribe to this blog's daily email here.
And if you would like to support this blog you can, here:


“how much national insurance was lost on dividends paid to avoid that tax?”
That’s perfectly acceptable, though, isn’t it?
This arrangement is commonplace and not subject to sanction.
It is legal, it is mostly done simply because a rather silly set of tax rates mean you can reduce your bill by two methods:
1) Switch earned income out of salary and turn it into unearned dividend income instead.
2) Convert income into capital instead.
Neither method is readily available to most of the population but they are to a considerable number of what are on the whole the more affluent, so the self employed and those with control over a company. This promotes inequality and unfairness. Obviously there are self-employed people, etc who do this to boost very meagre incomes, but that is a problem that needs fixed in a different way than distorting the whole tax system.
Just on Corporation Tax I was very annoyed to discover two years ago that my small two man band company was paying the same £4500 pa CT bill on our £23,000 profit as was paid by Facebook UK on their hundreds of millions of UK turnover (as strangely this was entirely unprofitable, or at least the profits showed up elsewhere).
Governments have been captured by corporate lawyers, lobbyists and the like to enable entirely legal methods to hide profits so that companies don’t have to pay tiresome tax. These methods are social constructs. They can easily be made illegal, and perhaps one day they will – when we have politicians with spines and a social conscience who place equity and fairness for the whole of society above the demands of predatory rich and their useful idiots.
Richard, now Neidle is claiming that you got the direction of CT receipts considerably wrong in 2014. Why do people make such unfair personal attacks? https://twitter.com/danneidle/status/1265674952918925312?s=21
How could I have done – I used HMRC data
I can’t see his tweets – he blocks me
I have asked Twitter to remove his post.
I would leave it be
I can’t see why that’s required
You can still read what he says. Nothing much in this case, just picked up on your predictions made in 2014
I have now seen it
He’s suggested the trend changed
But he used a different dataset to suggest that
And whilst I accept that the trend was not as I expected – and if I’d given myself longer than just over an hour to do this and see how the format worked I’d have dug deeper – what I’d have found is that the growth is down toi one sector in essence – which is banking and financial services
So the real question is why has its yield gone up so much
You could say it’s country-by-country reporting
I think it’s actually QE profits
But I also suggest Neidle is still comparing incomparable data sets to get to his conclusions and I have not
But to be candid, I did this because I was asked for data and I’m happy with all of it bar that one chart I did not refresh (yes, there’s a lesson in that) and am leaving it there
Just to say Dan Neidle has picked up on your blog to state that contrary to your claim he isn’t using a different data set, it is exactly the same but 5 yrs on. He also states that you are wrong in your claim all the growth in CT is from the financial sector.
“Murphy is a pretty marginal figure these days but influential in some quarters and this kind of disregard of the facts shows he really shouldn’t be”
He can’t be using the same data – small company data is no longer published as they no longer, as such exist
And HMRC say most of the growth is from financial services – and their data shows it
But what you really get is from the closing comment
That’s his wishful thinking
And as I have acknowledged, with more time I would have extrapolated the data
The claim is pure hard right ad hominem these days – and that’s where I place Neidle
So Dan Neidle never in fact blocked you. He also seems adamant his data and analysis is 100% correct. Are you?
It appeared I had been blocked
It was in fact me muting
And I note he has engaged with none of my arguments and is just playing ad hominem – and I am really not bothered in engaging with someone who has no argument and just a graph which compares data inappropriately
Ignoring as usual the unnecessary personal invective, you say “He can’t be using the same data — small company data is no longer published as they no longer, as such exist”. With respect, I don’t think that is correct.
What does “small” mean in this context? In your 2014 blogpost, the two lines you were plotting are “Large company quarterly instalment payments and balancing payments” and “Small company payments”. So “small” seems to mean any company not paying corporation tax by quarterly instalments – that is, one with profits under £1.5m. (By the by, until FY2014, those companies were also potentially able to claim marginal relief to benefit from the lower rate of corporation tax for small companies.) The main rate and small companies rate are now the same, but quarterly instalments still exist, with the same £1.5m threshold for “large companies” as defined in the Instalment Payment Regulations (SI 1998/3175).
It seems to me that Dan is just taking the same “quarterly instalment payments” line in the recent data to equate to “large”, and the “all other payments” (which replaced the “small company payments” line) line to be “small”. The figures in the new data up to 2014 are almost identical with the data you used up to 2014.
That new data shows quarterly instalment payments (i.e. large companies) increasing from £23.1bn in 2013-14 to £37.2bn in 2017-18, so increasing by about £14bn, but other payments (i.e. small companies) pretty flat, increasing from £13.6bn to £15.4bn. That data also shows the finance sector recovering from £4.9bn in 2013-14 to £10.3bn in 2017-18 (returning to pretty much the same figures as 2006-7 and 2007-8). So that is about a third of the £14bn increase in that period. Manufacturing, distribution, life insurance are pretty flat. The other two thirds (£20.5bn to £29.9bn) comes from “other industrial and commercial”. Only up 50%, not doubled, so in that sense the growth is lower, but accounting for most of the increase in terms of the amount paid.
Do you still disagree?
They’re not the same time series…..
But to be candid what I now realise is hopelessly wrong with his graph is he is using ONS data for profits – which does only very vaguely approximate to corporate profits as its a macro and not a micro measure – as his base line for showing that tax to profits is largely fixed. That really is an apples / oranges conmparison
And re the increase in other industrial and commercial – much of that increase is, I still suggest, smaller businesses. Those new entities did pay taxes….
Note he also appears to include bank levy in his tax payments….which is pretty odd
There is so much wrong with his claim I can’t be bothered to engage further with it
I accept that I did this in too much haste for someone at their request. There’s a lesson in that, I agree
But do I agree with his claim – which I can now very definitely suggest was based on inappropriate data that I rather strongly suggest he did not understand – no, I don’t
And nor do I think his personalisation of it becomes him at all
I really am struggling to see the point of the comparison that Mr Neidle has done, which as you say is very much like a comparison of different fruits. Is it perhaps to justify further cuts in the rate of CT? If so, the data might suggest that the burden of CT on UK corporates could be reduced by increasing the tax rate.
It might be instructive to see what the data for “overall effective rate” looks like over a much longer period of time. Having spent more than twenty of the last thirty years looking at Corporation Tax returns I am acutely aware of the myriad reasons why accounting and taxable profits diverge, but to see that the “effective rate” of CT bearing on corporate profits in 1997 was only 10%, or slightly less, seems intuitively unlikely. As you say, the enormous increase in small corporates whose accounting profits and taxable profits are very similar may have some bearing on the apparent trend. The effect of losses carried isn’t clear from this either – the effective rate seems to fall just prior to the 2008 crash, but whatever the effect the crash (which might reasonably be assumed to be a fall in corporate profits but a slight lag before CT receipts caught up) might have had is just not apparent here. Again, I would instinctively think there wasn’t any effect. I don’t know how the ONS obtains its data. If it is via Companies House, I would further observe that small companies these days appear able to file returns there that not only fail to disclose their accounting profits, but also other incidental details like their turnover or even exactly what sort of business they carry on.
Does my postscript help?
He’s done a nonsense calculation
The ONBS data is not useful in this context
Not really (and I don’t mean that as a criticism). Neidle compares a set of statistics against some actual rates of CT, in order to try to prove a point relating to his pre-conceived notions about the tax burden. Instead I think he firstly “proves” that CT may not be quite the burden it is accused of being [and as basically a tax on capital – starts a new fight with neolibs – I think it ought to be restored at least to its pre-Cameron government levels]. Secondly and more importantly he, to thinking observers, says more about the ONS stats than he does about the tax “burden” but as that isn’t conducive to his argument he doesn’t go there. That much ought to have been obvious to him by taking a step back and thinking about what this comparison appears to show. This is almost “I’m pink therefore I’m Spam” territory.
As a physicist (interesting career choice for someone with a physics degree…) Neidle should be acutely aware of the power of data, but more importantly the limitations on it; and instead he ignores those factors in order to press home his attack on you. I wonder if the whole point of this exercise was in fact to pick a fight with you. As a partner in a Magic Circle law firm he presumably considers himself one of the masters of the universe anyway.
His twitter feed does suggest that this was him simply being provocative
The interesting thing is a) he does not understand the accounting b) he has asked nothing about why corporate profits are rising, and does not ask at cost to who c) he seems only capable of assessing one variable at a time….
Amongst tax justice campaigners he is causing amusement. If his aim is to say we do not matter he’s going the wrong way about it
Richard
Apologies – undone myself with a double negative again. The sentence in the last paragraph beginning “Again, I would instinctively think…” should read “Again, I would instinctively think there must have been some effect.”
I really should go to bed!
Dan Neidle has picked your excuses to pieces.. then comes out with a classic
“ If it was anyone else, I’d think these were deliberate falsehoods. But it’s clear Murphy is acting in good faith – he’s just so convinced of his own rightness that details are irrelevant, and anyone points out errors is an evil neoliberal hard rightwinger.”
Odd how no one beyond his little bubble believes him
And I strongly suspect you’re in that bubble
Seems to be a description Mr Neidle is almost reveling in. I don’t think there is anything academic about this work he has produced. It is, if anything, observational, and he has precisely nothing to say about causation. What he ought to have said is that a substantial fall in the rate of CT for large corporates appears to have been accompanied by a rise in the effective rate of CT (and he explicitly – and rightly – says we are not on the downward slope of a Laffer curve in that respect), and that is so implausible it ought to cause doubt on the accuracy of our data relating to corporate profits [on the not unreasonable assumption HMRC aren’t telling porkies about CT receipts]. He in effect accepts the data uncritically. For the life of me I can’t see why anyone would draw such an inane conclusion from this data as he has. There are so many variables bearing on the ONS data as to make Neidle’s comparison utterly meaningless.
Agreed
There’s an amusing aside
He appears to be trying to discredit me. That’s obviously failing: I had a rush of tax professionals wanting to add me to their LinkedIn networks yesterday. He is the only explanation I can think of.
See Dan Neidle in action for yourselves here – https://www.youtube.com/watch?v=v3_goIEc0Og
To celebrate the ITR award for UK tax team of the year, the Clifford Chance tax partners have recorded a zoomcast, with their thoughts on the biggest tax issues facing business today.
The team cover the below topics (timestamped)
1:31 BEPs
4:32 EU blacklists
6:43 DAC 6
10:43 M&A warranty insurance
15:49 Disputes
20:07 Employment tax
24:54 Real estate tax
29:07 Supranational tax
I want to make it crystal clear that by posting the link to a clip (which is available to the public on youtube), in which Dan and his team at Clifford Chance present their take on ‘Whats hot in Tax’, I am not in any way advocating for the debate to gravitate towards personalities and divert towards name calling or trading insults and untruths.
However, I do think it is important to put things in context, get an insight and hear what Dan and his team have to say about offshore fund structures in Cayman Islands, HMRC litigation strategy, developments in EU law, and the use of a securitisation exemption in Luxembourg stuctured finance structures, which has now been deemed to be incomppatible with EU ATAD rules see 30:40.
“Odd how no one beyond his little bubble believes him“
It’s funny but this is about a miscalculation you made. You are making left / right/ neoclassical or whatever. Just admit you messed up and move on there is no shame in that.
For the record the “bubble” of Clifford Chance is quite a bit bigger than yours!.. your bubble is on here, people lap it up whether your facts are accurate or not. As long as the agenda is “on track” no one seems to know or care.
Have you noticed the postscript: I have had numerous people call me very amused by his mistakes
But I did make three mistakes
He had not blocked me: I apologised
I should not have engaged: long ago I learned there are people not worth engaging with in life and Nediule is in that category
And I should have taken longer – his arguments are risible. He does not understand deferred tax, data, the ONS data on profits and that they differ from accounting and taxable profits and much else
And now you’re another I no longer need engage with
And the corporate lobby has lost all the way on tax justice issues
Now go back to the Clifford Chance PR department….
Neidle is now saying you falsified your chart, and I am afraid he is making a good argument here. https://twitter.com/danneidle/status/1266371668684898304?s=21
Given the massive data errors in his own claims that’s just silly on his part
Oh, and wrong
I am troubled by this, Richard. You draw a trend line from 2000 that pictured declining revenues. Neidle has demonstrated that the data you used starts from 1999, and if you include that on the chart then the trend reverses: tax revenues increase.
If he is wrong I would like you to say why. If he is right then this looks bad.
I started, I rather strongly suspect, from the turn of the century
I choose a sample
I am doing it again with data right now
Did I fiddle anything? No of course not
Neidle has just done two things
One he has found data is not complete evidence, ever. It all needs interpretation
And amazingly he’s found not everyone agrees with him
Why not tell him to get his own data right?
And respectfully. I suggest you get a life if this is what causes you concern
Every day disputes like this happen in academia – to suggest there is anything unusual here is bizarre