I noticed that the Office for Budget Responsibility published government borrowing data for 100 years (actual and forecast) when producing its report on the last Autumn Statement. I promised myself I would take a look at this sometime, and that time has arrived. This is what a chart looks like:
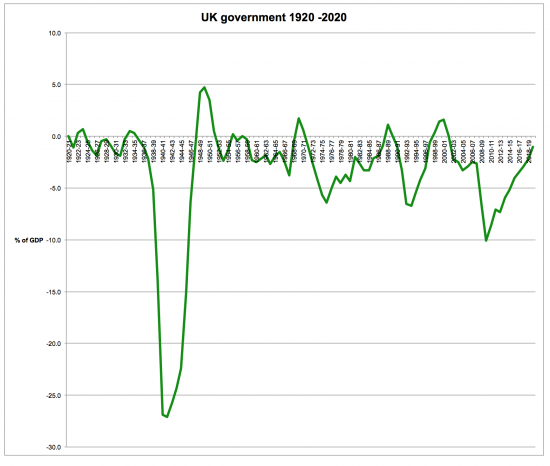
But what does it mean? To find out I determined which government was in office at the end of each of the years noted. The 1920 and 1940 wartime coalition governments were treated as such: the coalition governments of the 1930s and 2010s were treated as Conservative as it was their policies that held sway. On this basis this is a summary of the findings:
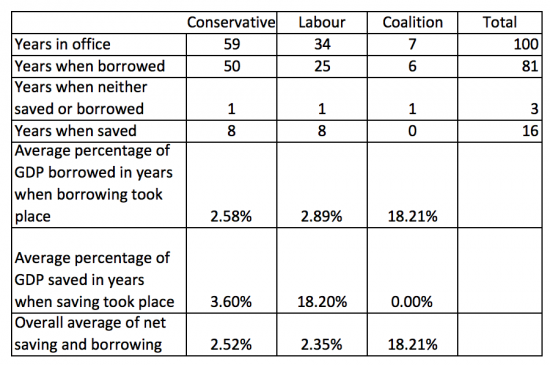
The Conservatives have very obviously held power more often than Labour. But the balance of both is sufficient for trends to be valid. As the data is all expressed as percentages of GDP inflation is not an issue. A number of trends emerge.
First, borrowing is normal.
Second, balanced budgets are incredibly rare.
FThird, Labour and Conservatives both saved in the same number of years, but since Labour were in office much less they were much more inclined to do so. They borrowed in only 73.5% of their years in office: the Tories did in 84.7% of their years.
Labour did borrow more on average. The difference is small though and neither borrowed anything like as much as wartime coalitions did.
The biggest difference is that when Labour saved it really saved: the Conservatives did so only marginally.
The result is that netting all data out the Conservatives on average borrowed more than Labour.
But, when I last undertook such an exercise I was accused of building in bias: it was said that Conservatives had to borrow to deal with the mess that Labour had left them. So I time lagged the data: for the first two years after a government left office I assume its policies had greatest impact on the economy. Only after two years was the incoming government really responsible for levels of borrowing. Doing this the following table emerged:
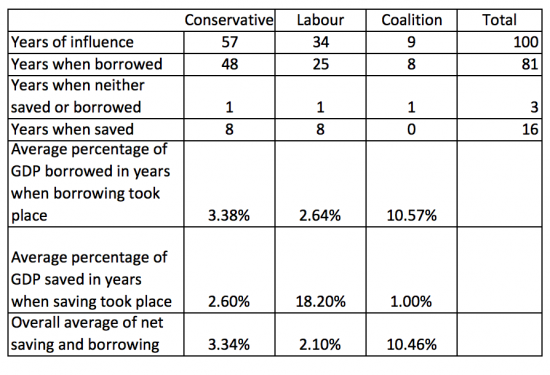
The number of coalition years now goes up because of the impact of the 1920s coalition on the opening data and two years of Tory influence fall out at the end. The number of Labour years of influence stays the same.
What is clear though is that Conservative borrowing rates go up (this is mainly because part of the war years now fall to them) and so the disparity between the parties increases. Most tellingly though it is Labour's borrowing rate that falls and since this is not largely because of wartime impact the evidence is that they suffer from inheriting Conservative positions and not vice versa.
I concluded from past research that the Conservatives were the biggest government borrowers over a period of 70 years. Extending the data to 100 years confirms the conclusion. If a debt narrative has any significance (and I question that) then it is the Conservatives who have the questions to answer on the UK.
Thanks for reading this post.
You can share this post on social media of your choice by clicking these icons:
There are links to this blog's glossary in the above post that explain technical terms used in it. Follow them for more explanations.
You can subscribe to this blog's daily email here.
And if you would like to support this blog you can, here:

 Buy me a coffee!

“Third, Labour and Conservatives both borrowed in the same number of years, but since Labour were in office much less they were much more inclined to do so.”
Is that what you mean to write?
Saved was the correct word
Now corrected
Thanks
Good analysis which proves that the Tory Party is even more economically illiterate than presupposed. Question: what did their borrowing go towards? Certainly not an investment in the social fabric of the nation. As for the electorate, evidentially it has always believed that if you wear a Savile Row suit, Jermyn Street shirt, speak ‘posh’ and exude self-confidence you must know how to run the country, as it keeps re-electing these incompetents. Plus ça change ….
It reminds us that Tory party is not really concerned about public purse as long as it benefits the 1% they feel they represent AND this cost is bourne by 99%
In my humble opinion the tories are just doing what the wealthy have always done. Use other peopls resources and leave them to pick up the bill. Much practised in the 1800 hundreds when the tailor and boot maker (and many other suppliers) could be made to wait forever for payment.
Well. yes, Labour did not have a majority until 1945, previous being coalitions under serious constraints, and the period to 1951 was one of very limited world credit available, largely from the USA with strings attached. Then it was 1964 to 1970 another bad time to borrow and 1975 to 1979 was no better. In any case if Labour then was reluctant to put themselves into the hands of the money lenders this was no bad thing. So until Tony and Gordon there were only 15/16 years in the last century for them to borrow. Mind you T&G did their best to make up for it.
I presume you didn’t like the analysis. T&G actually saved for several years. The big hike in spending was due to bailing out the banks- a world wide banking crisis stemming from big bang and deregulation initiated by Thatcher, and encouraged by demands for even fewer regulations by the Tory opposition. I presume it makes you feel better to carry on with your prejudices regardless of any evidence.
T&G did run a surplus for a couple of years. They also ran a deficit from about 2003 onwards during a credit bubble. Which on reflection seems idiotic. Not that the Tories would have done anything different of course.
Excellent article. Should be required reading for every economics, social and political studies student and every aspiring politician. We live in a critical time facing combined ecological, economic, social and political melt downs. To prevent mass global poverty, resource depletion, irreversible global warming and major social unrest we must get to grips with alternative thinking that you advocate.
Your analysis assumes that there are no time lags whatsoever between a government’s actions and the impact those actions might have on borrowing – in your analysis, these cannot be separated. This is an absurd assumption.
It may be the case that one government’s higher borrowing is a necessary result of the mess that the previous government made in handling the economy. A prime example of this is the 2010-15 borrowing figures. Borrowing was always going to explode from 2010 onwards, as a result of what happened in 2008-09.
I allowed two years for this – and it made it worse for the Tories
And for the record 2008-09 was not Labour’s fault unless they ran the US economy