A new report by me analysing the result of EU bank's country-by-country reporting under the terms of the Capital Requirements Directive has been published by the EU's Green MEPs, for whom I undertook the analysis. The report is available here. The summary says:
This report is based on the country-by-country reporting of 26 European Union based banks, 17 of which had published the full data now required of banks by the time the report was prepared and nine of whom had still only published the partial data permitted in 2014.
The country-by-country reporting from these banks was used to test the hypothesis that some or all of these banks may have been systematically over-reporting their profits in low tax jurisdictions or places identifiable as tax havens whilst under-reporting them in those places where they are either based or have major centres of operation.
The report suggests that this hypothesis has been found to be true: overstatement of profits in identifiable low tax and offshore jurisdictions appears to be occurring based on the data published by the banks surveyed.
The report addresses the issue of profit relocation in two ways. Firstly, using the principles of unitary tax reporting, which would apportion profits to states where they could be taxed at local rates (a system akin to the European Union's Common Consolidated Corporate Tax Base) based on evidence of real economic activity taking place in that jurisdiction as represented by turnover and people employed it was estimated for the seventeen banks that reported full data, using their data in aggregate total, that it was likely that there was systemic reallocation of profits, or base erosion and profits shifting as the Organisation for Economic Cooperation and Development describe it.
This result was very clear: as section 11 of this report makes clear a review of 131 jurisdictions shows potential reallocation of profits exceeding €100 million into or out of the following jurisdictions:
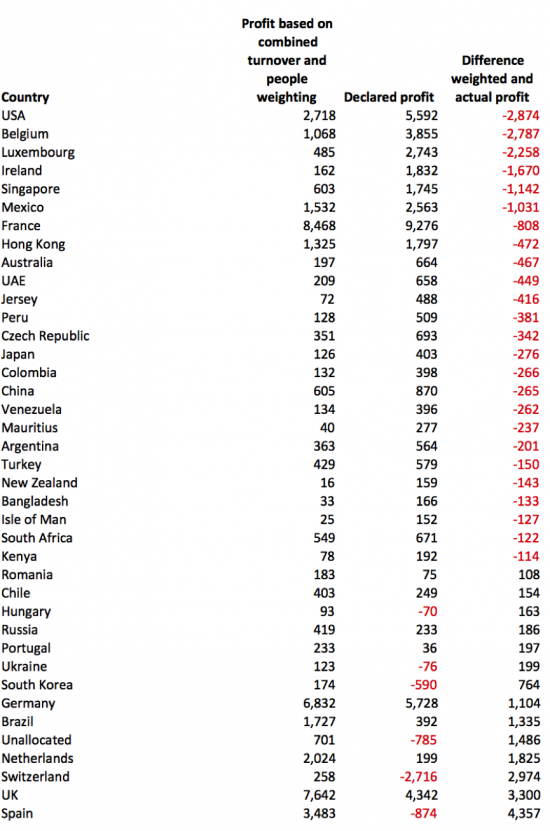
Data in red in the right hand column indicates over-reporting in the jurisdiction whilst data in black indicates under-reporting.
There can be no doubt that some of the reported differences are due to underlying economic circumstances. The Swiss data is, for example, distorted by a €2.9 billion loss reported by BNP Paribas in that country. UK data is also likely to be distorted by head office functions recording losses as a result of fines for financial misdemeanours charged on many UK banks. The Spanish economy has also, undoubtedly, had a difficult time.
The lesson from the Netherlands and maybe the UK and Germany is, however, that it does not appear to pay, at least in terms of reported profit and so likely potential tax yield, to host bank headquarters. This does not, however, appear to be true of France, which appears to enjoy over-reporting of profit. It is also not true of the USA, which appears to have exceptionally high profit reporting: why is not readily apparent although some banks e.g. BNP Paribas suggest that income from the Cayman Islands is reported by them in the USA.
It is notable (but not shown here) that there is exceptionally low reporting of income and profits in many of the expected tax havens such as Bermuda, Cayman and the British Virgin Islands. This is also true of Guernsey, although it seems likely that many banks include data for this island in their reporting for Jersey.
What is, perhaps, unsurprising is that there appears to be above expected reporting in many jurisdictions where this might have been anticipated including Belgium, Luxembourg, Ireland, Singapore, Hong Kong, UAE, Jersey, Mauritius and the Isle of Man, all of which have a reputation for acting as offshore tax locations for various reasons. Prima facie evidence of the relocation of profits to locations where that might be expected to provide a tax benefit does, therefore, appear to exist based on this data.
Secondly, assessment of the reporting of individual banks was undertaken. Because analysis of country-by-country reporting data is a new field of accounting research four possible methods of assessing potential profit shifting within individual banks were used in this survey with the results then being combined to provide an overall ranking. These methods were:
- To consider the amount of potential reallocation of profit within the financial statements of each bank surveyed based on the unitary taxation methodology noted above;
- To determine the individual jurisdiction in which the bank recorded its highest income per employee and the ratio of difference between that level of income and that for the bank as a whole as a measure of the aberrance of activity in that highest earning jurisdiction;
- A similar measure to that described in (b) except for profit per employee;
- A method combining three measures of overall ratio differences in distribution of implied, profit, tax paid and turnover allocation within banks to identify the degree of diversity of behaviour in the surveyed banks.
Each of these rankings was then combined to produce an overall ranking for the surveyed banks, with a rating of 1 indicating the highest risk of base erosion and profits shifting taking place, although, it is stressed, not proving that it does:
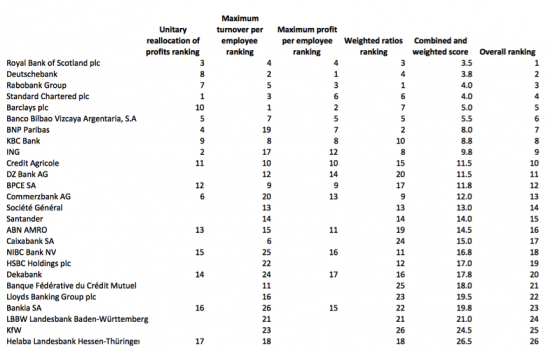
Broadly speaking the four measures moved in line with each other with none at this stage, and with this limited amount of data, proving to be conclusively the most useful. Equally, it is clear that reliance on one alone may be insufficient: Royal Bank of Scotland may come top overall but does not in any individual ranking.
Broadly speaking larger banks appear more likely to be profit shifting. As the detailed findings for each method show, the disparity in behaviour is very wide, some banks appearing to have considerably more risk inherent in them than others.
Some European Union jurisdictions emerged as very clear potential destinations for the relocation of profits in these surveys in ways not apparent from the country data. In particular Ireland seemed a particularly likely destination whilst Malta also stood out. Some other destinations, such as Finland, were harder to explain.
What is clear, based on this survey, is that:
- Country-by-country reporting data is useful, and powerful;
- Country-by-country reporting data can be interpreted in ways predicted to be useful before any data was available for analysis, and the results generated generally support anticipated outcomes;
- The risk that profit shifting is taking place is real;
- The risk that some countries are seriously losing out in terms of revenue and profit reporting as a result appears to be high. This is particularly true of states that host bank head office locations, France excepted;
- Some EU countries appear to be gaining from tax competition in ways that appear inconsistent with the level playing field required by the internal market;
- Tax haven activity is significant.
In addition:
- The limited amount of data required by CRD IV Article 89 reduces the usefulness of the survey undertaken, most especially with regard to tax data where there appear to be worrying variations on the way in which data is being presented between different EU countries, so reducing the use of the data when all accounting information only has use in comparison;
- Worrying inconsistencies in the data surveyed have been found so that some banks report all the jurisdictions in which they trade whilst others only report a selection;
- There is room for considerable enhancement in the data published, which issue is the subject of the recommendations that follow this summary.
Thanks for reading this post.
You can share this post on social media of your choice by clicking these icons:
You can subscribe to this blog's daily email here.
And if you would like to support this blog you can, here:


All this report does is prove my point that CBCR gives little or no useful information.
You have tried to compare banks with completely different business models (retail vs investment banks), who operate in completely different regions (for example, StanChart operates mostly in Asia, Middle East and Africa – not in Europe) and shove them all into a one size fits all treatment of the data.
Because the data set is essentially useless, you are then forced to give banks rankings – a relative measure – rather than absolute results. With all these obvious limitations you then conjure up even more tortured devices (“Profit based on combined turnover and people weighting” for example) which have no bearing on the underlying business the banks may or may not be involved in and thus useless. It’s no surprise that you have have to use the word “potential” repeatedly throughout the document, as simply you have no hard evidence to prove anything one way or the other.
StanChart is a great example – you suggest the may be reallocating 40.5% of profits but as I say, most of their business is carried out outside the EU/UK. But because you have weighted their data against a selectin of mostly EU based retail banks, it makes it look like they are profit shifting.
You also make the simlpy enormous assumption that staff numbers are directly proportional to turnover, and thus profits. Which is of course nonsense. Retail banking is a low margin business which requires high staffing intensity. Investment banking is high margin but doesn’t need a large headcount. One investment banker can easily be more profitable for a bank than hundreds if not thousands of retail bankers. But of course your data simly cannot account for this, making your comparisons utter rubbish.
I also note you have made little of the fact that the “average tax rate” you calculate is 28.5%. In the EU very few countries actually have corporation tax rates above this level:
https://en.wikipedia.org/wiki/Tax_rates_of_Europe
If these banks were profit shifting to the level you are alledging, why is the average tax rate so high? Surely if these banks were truly doing what you say they are their tax rates would be a lot lower?
Of course, this should come as no surprise, as firstly, you have no real evidence from this data for profit shifting – you are simply making allegations – and secondly, CBCR data only reports tax paid in a given year, when in reality tax may be paid over a period of years. Turnover, profits and tax and not prepared on the same basis in CBCR, once again making the data superfluous.
I assume you are being paid handsomely by Molly Scott Cato and the Green MEP’s for this, with the money ultimately coming from EU taxpayers.
First, the data covers all countries, not just the EU. You should have noticed. So that destrtoys all the nonsense about Standard Chartered et al
Second, we all know head line rates do not equal actual rates. Maybe you don’t though? Time to learn about what happens if the real world if you don’t
Third, I recognise that tax shifting is not all that is going on. That is appropriate. You take it as sig I can’t draw a conclusion. I am actually saying, totally appropriately, it can;’t explain evrything. But you iugnore that
Fourth, all that being said excess profits turn up in all the places we’d expect based on being tax havens. Now we all know correlation does not equal causality but the OECD thinks this is a major sign of profit shiufting, and so do I. I think the balance of informed opinion is rather firm;ly on my side
Why offer several indices? Because CRD IV data is poor and nothing like what I really want so I explore ways of looking at it. That’s called research and being open minded
And yes, I recognise that weakness in tax data in the report – I hiughlight it in fact in the report – and make clear that the OECD template data would overcome this
So you add not a thing here but petty jibes when best data clearly shows there is a major problem you would like to ignore
Why would you want to ignore unambiguous prima facie evidence of tax abuse?
And for the record I have consulted with Molly Scott Cato and was paid – £5,000 from EU funds
1. I am not saying that the data doesn’t cover non-EU countries. You are constructing a straw man here. I am saying that you are trying to compare banks of different types and regional business models, and then essentially average their activity, which is wholly incorrect. It will by definition lead to answers skewed to reporting profit shifting.
2. Again, you are constructing a straw man. Headline rate, as you call them, are not taken into account by CBCR, not least because tax can be paid over several years and CBCR only takes notice of tax paid in a single year. Again making CBCR data unreliable.
3. CBCR actually explans nothing here. You have no hard evidence for profit shifting. You are basically just pointing fingers.
4. Again, no evidence. As I say, if this was all about profit shifting, why do these banks seem so bad at it? The highest reported actual profits (rather than your “profit based on combined turnover and peole weighting” metric – a suspect number at best as I explained) seem to occur in banking and finance centres – UK, US, Germany, France, Hong Kong and Singapore etc. All with a variety of coporation tax rates. So there doesn’t seem to be any strong correlation between profit reported and being a “tax haven”, but there dooes with being a major financial centre.
Ranking banks is purely a relative affair, and is subjective. Your ranks are dependent on the measures you use to rank them. They also are entirely dependent on the sample constituent and size. This is not evidence. You simply cannot with any degree of certainty state that any of these banks is engaging in any profit shifting. Apart from the poor standard of pseudoeconomic work, this is simply a hatchet job full of allegations.
The OECD template is very similar to the EU CRD4 template, requests very similar data and suffers exactly the same problems in terms of accoutning vs reporting standards – as the OECD itself admits.
The point I am making is that from this data, we simply cannot tell that there is a problem. CBCR is an abject failure when it comes to proving anything. It’s a massive success though, if like you, all you want to use it for is to cast aspertions. No substative evidence means no substative results, and certainly no corrobaration of yoour hypothesis.
Well, that’s 5,000 pounds wasted. I assume it won’t be the last spent in the same way, and I assume you will be paying tax on it. Though if TRUK was subject to CBCR, where would you be paying that tax, given the money was earnt in the EU by a UK entity? CBCR actually allows you to report that transaction in two seperate ways legally, thus giving little useful information.
CBCR is a risk assessment tool that suggests whether it is more likely or not that a company is shifting profit
The results are that there is prima facie evidence that banks are shifting profits
And I think it fair to say you don’t like that
But for all your bluster you have not actually addressed the fact that if I was wrong there would be no prima facie evidence of relocation to places identified as tax havens in many cases
I have never said CBCR answers all questions – no accounting data does, as a matter of fact. It always poses questions, if you were not aware of that fact. But I suggested CBCR would highlight a particular risk and sure as heck it does
I rest my case. You have not come near denting it