My friend and occasional co-author, Howard Reed has written an article under the above title for the Fabian Society. I recommend a read. As they summarise the article:
Howard Reed finds that the impact of the coalition's tax and benefit measures could end being as bad for inequality as the Thatcher government's record. Turning the tide needs to be at the heart of Labour's strategy for government.
As Howard argues:
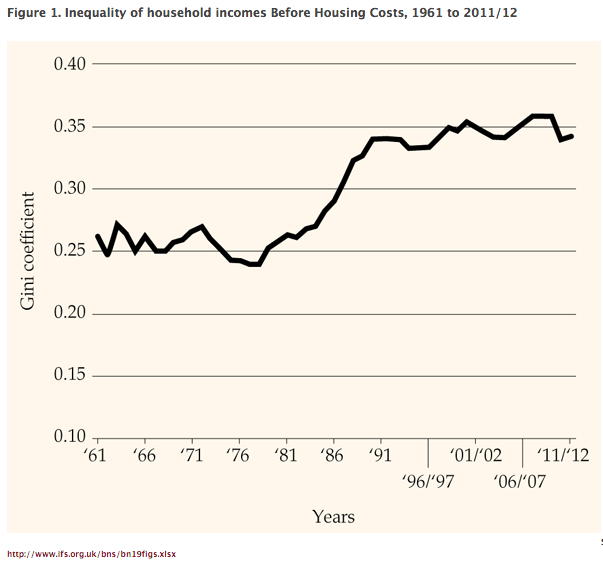
Inequality in the distribution of incomes is the result of a combination of two factors. One is the distribution of gross market incomes, ie income before taxes or transfer payments. The largest component of gross incomes is earnings, but the distribution of incomes from investments and (private) pensions, and property income, are also important. The other main factor determining the distribution of net income is the extent of redistribution by the government through the form of taxes and transfer payments (eg benefits, tax credits). Inequality can rise thanks to increasing dispersion of gross incomes, a reduction in the extent of redistribution, or both. Thanks to household surveys conducted on an annual basis from 1961 to the present day, we now have around half a century of data on the UK income distribution on a reasonably consistent basis. Figure 1 is based on analysis of this data by the Institute for Fiscal Studies (IFS) and shows the evolution of inequality in disposable income since 1961. The measure of disposable income used is net household income before housing costs, adjusted for family size. The figures go up to the 2011-12 tax year which are the most recent figures currently available.
That figure is as follows:
As Howard concludes:
Broadly speaking, the evolution of inequality in Britain over the past 60 years comprises three distinct phases:
-
Between 1961 and the late 1970s, inequality was roughly stable, with a Gini coefficient in the range 0.24 to 0.27.
-
Inequality rose consistently from 1979 onwards, with the Gini moving above 0.27 in 1985. By 1990, the Gini had reached 0.34 — a rise of 0.07 in just five years. The 1980s were a period of persistent rises in inequality.
-
From 1990 onwards, inequality stabilised at a Gini of around 0.33 to 0.36 and has remained at that level until the present day.
But, things are changing:
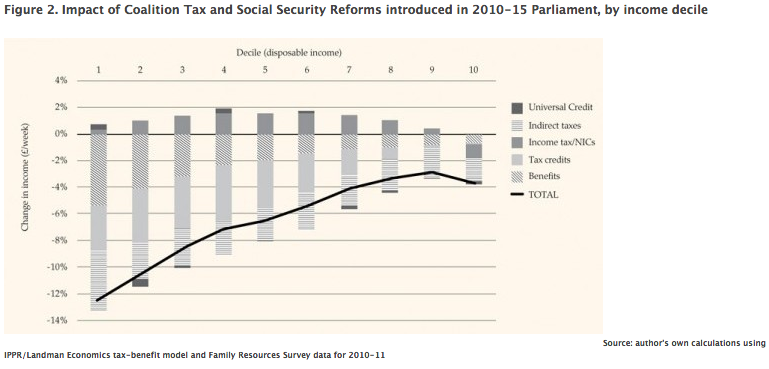
Figure 2 presents a breakdown of the distributional effects of most of the reforms made to the tax, benefit and tax credit system over the course of the current parliament using a tax-benefit micro-simulation model constructed by Landman Economics for the Institute for Public Policy Research. The analysis divides families in the UK income distribution into ten equally sized deciles ranging from decile 1 (the poorest) to decile 10 (the richest). The line in the graph shows the overall impact of reforms to the tax, benefit and tax credit systems as a percentage of disposable income, averaged across all families in each decile. Overall, the reforms introduced by the coalition are regressive across most of the distribution — the poorest families lose over 12 percent of their net income on average, compared with only around 3 percent of net income for families in the ninth decile. At the very top, the reforms are slightly progressive, with the top decile losing a slightly higher percentage of their income than the ninth decile; this is mainly due to increases in national insurance contributions and below-inflation increases in the higher rate income tax threshold.
The main factor driving the regressiveness of tax and benefit reforms between 2010 and 2015 is cuts to benefits and tax credits, particularly for working age families with children. The generosity of working tax credit, in particular, was cut back severely over this period. Furthermore, the uprating regime for working age benefits and tax credits has been changed from the retail price index (RPI) to the consumer prices index (CPI), and as annual CPI increases are typically smaller than RPI, this means that households reliant on benefits and tax credits lose out increasingly as time goes on. The decision in the 2012 Autumn Statement to limit working age benefit and tax credit increases to 1 per cent in nominal terms — well below CPI inflation — exacerbates the regressiveness of the reforms to social security. Meanwhile, coalition reforms to income tax and national insurance contributions during this time — principally the above-inflation increases in the income tax personal allowance and the lower thresholds for national insurance contributions — help families in the middle of the income distribution more than the poorest families, most of whom were not earning enough to pay income tax or national insurance in the first place.
That distribution impact looks like this:
The result is that we have every reason tho think that as more data becomes available inequality will rise in the UK. As Howard puts it:
The impact of the total package of tax and benefit reforms between 2010 and 2015 is to increase the Gini by 0.018 points — more than half as much again as the total increase in the Gini which arose from tax and benefit reforms over the period 1978 to 2008.
That gives anyone concerned about poverty very real reason to worry.
I strongly recommend the rest of the article.
Thanks for reading this post.
You can share this post on social media of your choice by clicking these icons:
You can subscribe to this blog's daily email here.
And if you would like to support this blog you can, here:


And if you want to protest about this, better do it quickly. It looks as though any kind of gathering or protest is being outlawed. Cameron’s obviously expecting to get rumbled by the broader population at some point and in the manner of despots everywhere is preparing to outlaw all and any dissent. This is chilling especially when one considers also the reduction in legal rights Grayling’s bringing about at the MOJ. I suspect he and his cronies will learn eventually that you can’t put that particular genie back in the bottle but to me these actions serve to underline my earlier assertions here and elsewhere that we’ll soon be seeing civil disturbance on levels not seen since Cromwellian times. Looks like the Coalition agree with me and are taking steps to nip all protest in the bud.
Have a look at Spain, despite its troubled economy, it can magic up a yoy increase of 1,780 percent on riot control gear. I’m sure the troika raised no objections to this gdp enhancing move.
What I would love to see is more comparison in reports of these sorts of statistics with other countries. Of course one can look up Gini coefficients, for example, online, but it’s often difficult to tell if they are directly comparable because of methodological differences.
In that case you might like this link
http://www.huffingtonpost.com/les-leopold/big-lie-america-doesnt-ha_b_3516185.html?utm_hp_ref=tw
If you read through the proposed law you will note the rather draconian part relating to tenants (section 13. Tenancy injunctions: exclusion and power of arrest)”
The law will outlaw any gathering at all, even football matches, if the police think any anti-social behaviour may happen.
I see labour, by their lack of any protest, are in favour of said law.
Looks like we are heading for a two-party dictatorship.
Which brings to mind something else I was suggesting a while back; that the Coalition might broaden to include the two Eds and future elections might be dispensed with. It’s looking more likely now, isn’t it?
5566hh
(if that is indeed your real name!)
You might find the following interesting:
http://www.oecd.org/els/soc/OECD2013-Inequality-and-Poverty-8p.pdf
Is this not a distortion of the facts to suit your preferences?
Has not the actual Gini fallen between 2010/11 and 2011/12?
This is a fixed chart altered by removing housing costs to show an uptick in the Gini when in fact by the usual widely used method it fell…..
Are you sure your comment does not reflect your own bias?