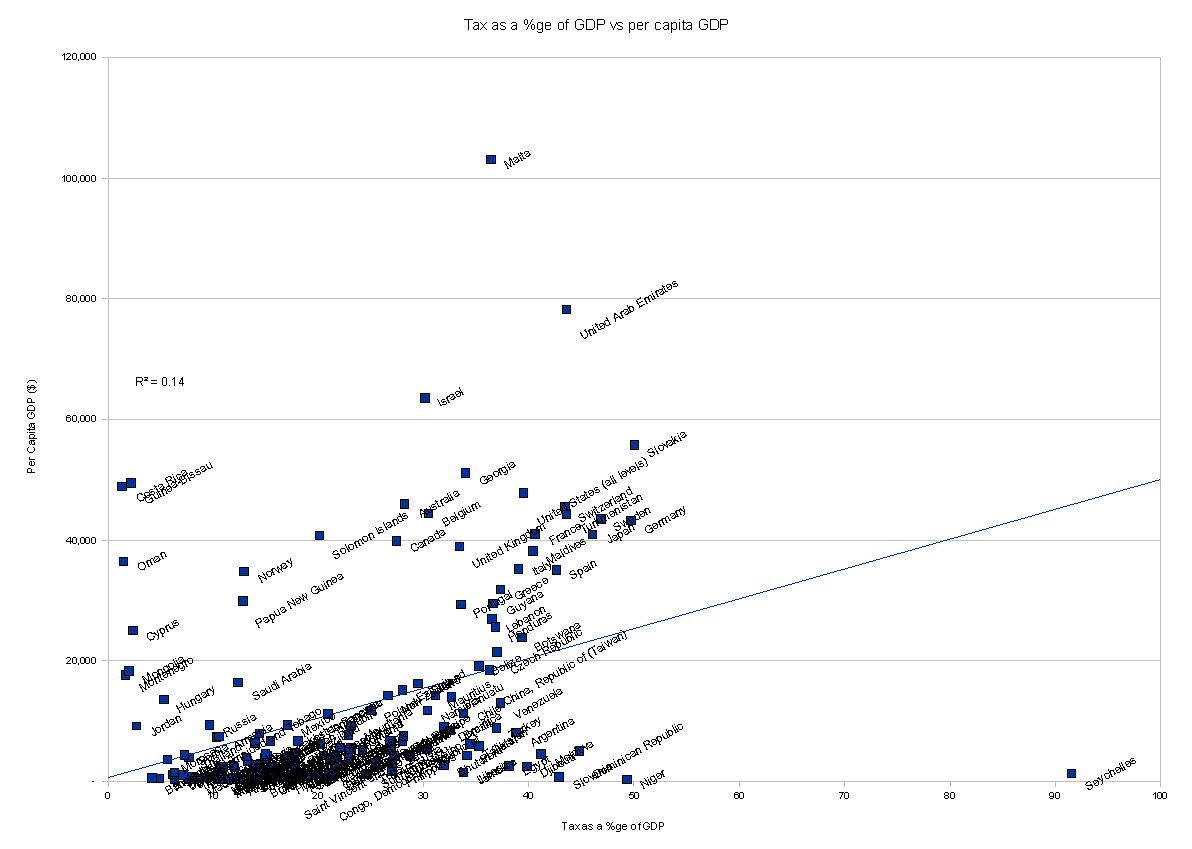
 I put up a blog yesterday under the title ‘Why you’re better off under a high tax state’. I was pretty happy that the data I presented showed in the way I presented it the story I wanted to tell. My right wing critics weren’t happy with that, of course, and did, as usual, play the man not the arguments.
But one commentator — who has for reasons he has explained to me wished to remain anonymous — decided something much more constructive could be done with the data. That was possible — because as is my usual practice I don’t simply make assertions — I publish my data too
He took it, reworked it and from thereon I’ll pretty much use his own words to describe what he did and found:
First of all, as far as I can tell, the regression coefficients Gary has referred to do not reflect a particularly robust test of the correlation we're talking about. I'm afraid the reason for this is that the way the trend lines in your graphs appear to have been produced is not the best way of using these data. I think what they effectively demonstrate is the extent to which a country's rank in the tax-rate league table is correlated with its per capita GDP. As we see, there is a correlation, but what they don't reflect, however, is the correlation between a country's actual rate of tax and per capita GDP. The size of the difference in tax rate between a country and the one ranked immediately below it is not factored in. Fortunately, given the distribution of the data and the number of countries involved, this doesn't appear to have a huge impact on the correlation demonstrated, but in order to conduct a robust analysis it is inappropriate to reduce the data in this way.
That's the bad news. The good news is that, when you do a more powerful test, a stronger correlation is demonstrated, at least for the dataset which includes only the larger countries.
Please find attached some graphs I have produced from the data. I believe these more clearly demonstrate the correlations you've described.
[The first graph uses the first data set — of all countries]

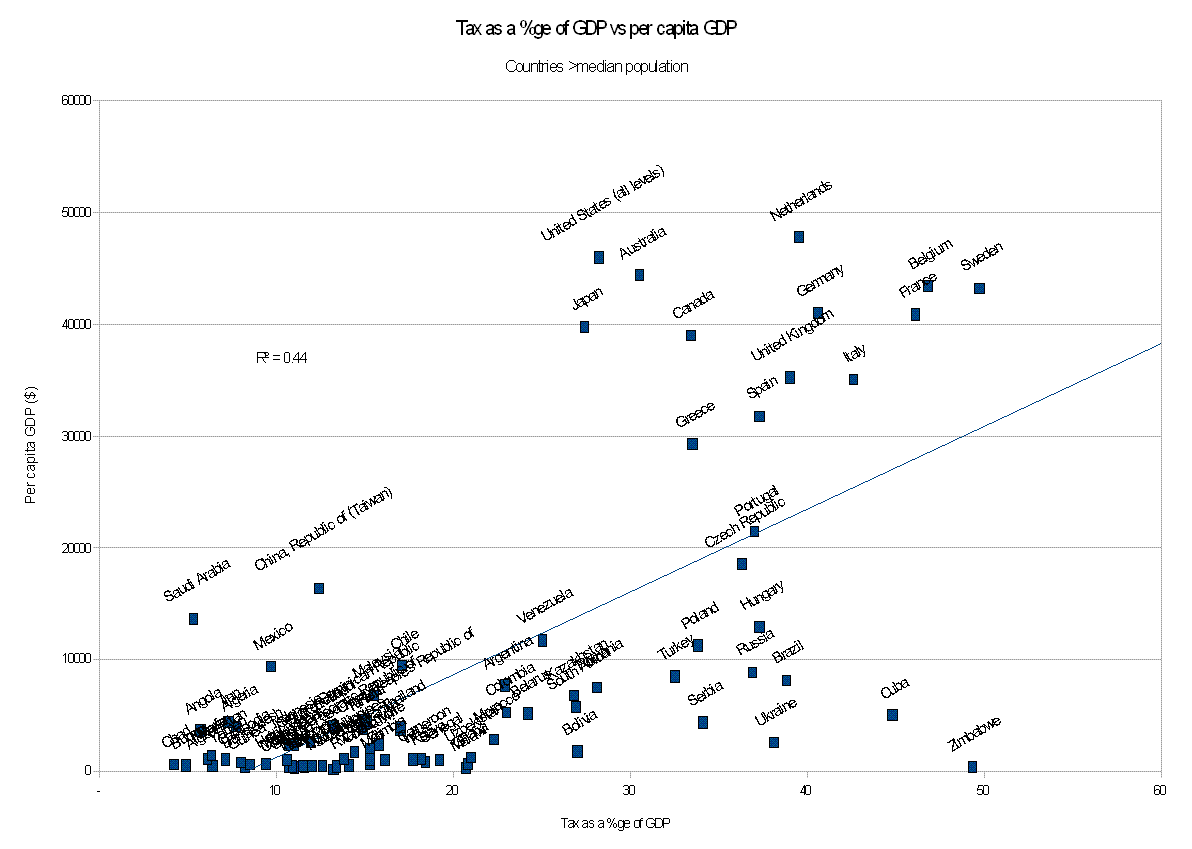
[The second data set is of the top 85 countries by population]

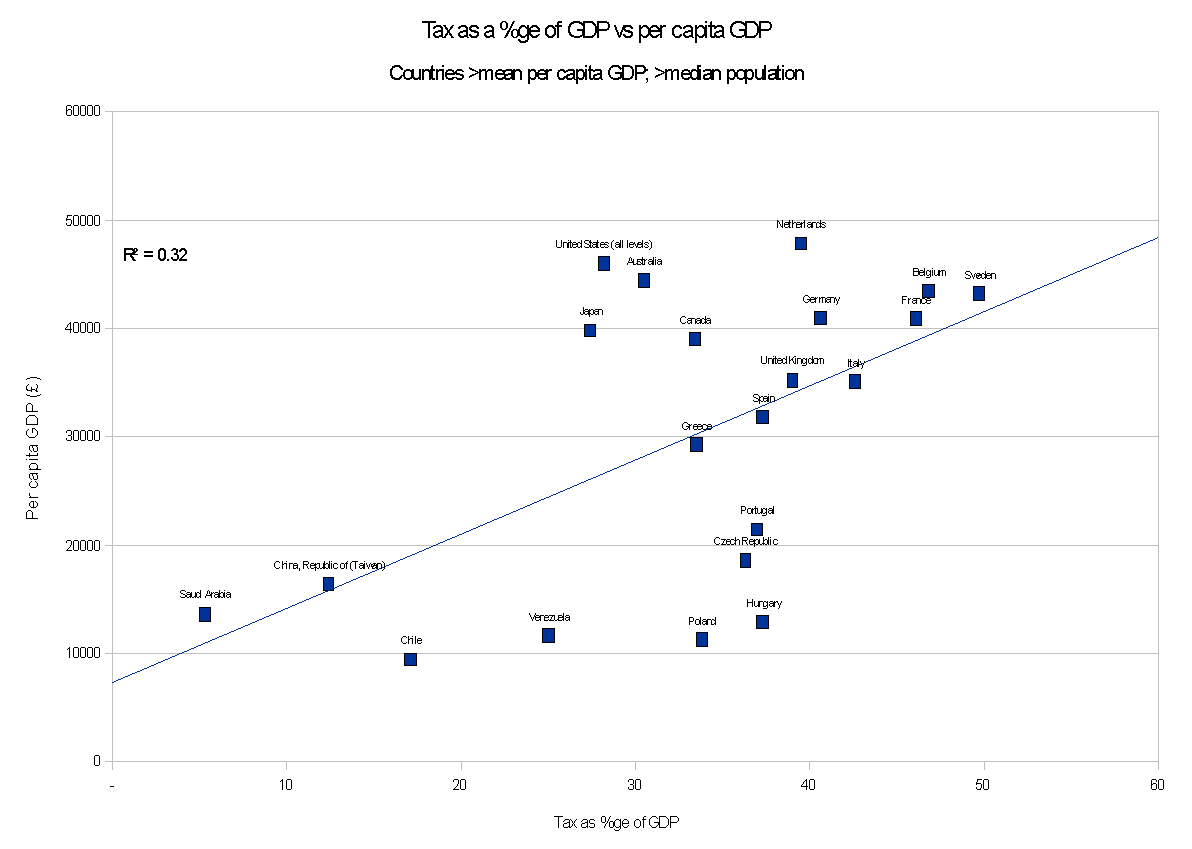
In addition to the data cleaning you've done (i.e. excluding the smallest half of the countries), I've produced a third graph considering only (larger) countries with a per capita GDP above the mean.

The (slightly less) strong correlation shown among this group appears to suggests that tax as a proportion of GDP remains relevant even as a country becomes more prosperous.
It should be noted that, whichever (sub)set of data is used, the correlation is highly statistically significant. For the stats geeks like me:
All data: R^2 = 0.14; p<0.0001
Countries above median population: R^2 = 0.44; p<0.0001
Countries above median population; above average GDP: R^2 = 0.32; p<0.0073As Gary suggests, the R^2 values indicate that other factors are at play: given the complexity of an entire country it would be absurd to expect there not to be. However, the p-values are an estimate of the probability of the observed correlation being down to chance. Values under 0.05 are regarded for most purposes as statistically significant; <0.001 as highly significant. It certainly looks like something is going on.
All in all I think it's a worthwhile and interesting question to be looked at, and certainly merits further attention. In the light of the Wilkinson and Pickett analysis we should perhaps be questioning the importance of GDP growth as a policy goal for its own sake in a developed country, but as those on the right in favour of regressive taxation are so keen to argue that low taxation promotes GDP growth, evidence that the opposite is true is yet another weapon against them.
My considerable thanks to my commentator.
As I said when doing the original data — the connections seem obvious. This analysis shows they are in a more formal presentation.
I await the nitpicking.
But I think the challenge implicit in my commentator’s last paragraph is interesting.
Thanks for reading this post.
You can share this post on social media of your choice by clicking these icons:
You can subscribe to this blog's daily email here.
And if you would like to support this blog you can, here:


This is so impressive. I much prefer regression analysis to correlation…. well done both of you.
To repeat my earlier comment: you need to control for size of informal economy, as this both reduces tax take and holds back growth.
I would also add: it is not essential to the case of those arguing for increased public spending that it boosts GDP, merely that it does not harm it. On the other hand it is central to monetarist dogma that lower taxes lead to increased growth. The burden of proof is on those making this claim, and to my knowledge they’ve never come close to satisfying it.
If we dont aim for GDP growth, then what do we aim for instead?
It seems to me that Wilkinson and Pickett fall into the trap that Tony Crosland and Francis Fukuyama both fell into of saying that in effect we have reached some sort of end point in history (economic history in Wilkinson & Pickett’s case, with their assertion that GDP growth has done all it can).
Many people have called the end of history (or at least some part of it). Every single one of them has been wrong, whether from the right or the left. i am intrigued as to why anyone thinks Wilkinson & Pickett will be the first ones to be call it right.
GDP includes services. Services do not consume much in the way of non renewables so growth in the service sector is achievable. Govt needs to become more involved in repricing non renewables (and land, which is a problem because it cannot be consumed – but that’s easy). A better objective to aim for is full employment. Govt also needs to get involved in the pricing of labour by increasing the minimum wage so that it is a livable wage. Employment is the best form of distribution of wealth.
@MrSnuffleupagus
The objective is human flourishing
Full employment undoubtedly helps people achieve that
So does a great deal only the state can supply to most people
The pursuit of material well being rarely helps it – unless you’re very poor – and the ConDems have unambiguously got it in for them
No nitpicking from me. On the contrary, an attempt to draw higher level conclusions.
I stand corrected. Mr Murphy’s data suggested 0.396, which is now superceeded – and I fully agree that it IS superceeded – by Deep Throat suggesting somewhere between 0.32 and 0.44 depending on the (sub)sample set. Not really a fundamentally different answer from 0.40, but a superior method for sure. Not that any of the data was mine, but I’ll accept any number between 0.32 and 0.44
Let’s say that the causality runs as Mr Murphy instruct us it does; that more tax/state revenue DOES deliver better public services (for regular visitors will remember that’s the origin of this debate). Let’s also say that this link is most definately not random; in fact perhaps 40% of this improvement is to the credit of the taxpayer for funding it.
It would therefore seem to necessarily follow that most of the improvement in public services is NOT down to taxes/funding/revenue. According to the Murphy/Deep Throat analysis, around 60% of the improvement in public service is driven by something *other* than funding.
If these conditions hold, then Murphy/Deep Thoat would seem to have reached an important insight that supports some useful conclusions:
1) funding of public services is necessary but insufficient.
2) Taxes have a relevant and important but ultimately minor role (c.40%?) in the improvement of public services.
3) Proportionately speaking, the majority (60%?) of our collecive time, energy, policies, research and resources should now be dedicated towards identifying and resolving those more important drivers of excellent public services.
4) An important role still exists to refine the role of tax in the delivery of public services, but only within that boundary described by the Murphy/Deep Throat analysis (c.40%), and claims to be the majority driver of public service excellence can hence be deemed disproportionate.
5) Those who do not accept the Murphy/Deep Throat analysis and insist that this is entirely a matter of funding can register their concientious objection by depositing a large voluntary payment with HMRC, and can campaign for like-minded souls to do likewise.
I realise this is not a helpful conclusion to those with vested interests (and I’m not saying that Deep Throat is but I am saying that that they do exist), but it is helpful from an ‘evidence-based policy-making’ perspective in clarifying for me at least the useful limits of tax in the delivery of public services and does seem to follow directly from the Murphy/Deep Throat analysis without any data contaminated by extremists.
PS. I am writing in a personal not professional capacity, I am not seeking to represent my employer, etc etc
This makes sense. In countries where taxes take a lower percentage of the GDP, rents can take a higher percentage of the GDP (and if they can, they generally will). But whereas governments have, for the most part, to spend tax income via government expenditure or investment within the country, the rentiers are under no such obligation and can choose to transfer the rental income to another country. Hence taxes tend to grow national GDP whereas rents tend to shrink it.
Economic data will not be the same without the use of GDP. So what is the right formula for economic success? It is anybody’s guess. You can hit the numbers but the opposition will ask about the quality of life. You subsidize housing and food and they call you a socialist.
2nding Carol,
Full employment would do more for the ‘fiscal crisis’ than cuts. For the privateers, it would expand choice for employees and enhance competition amongst employers. Who could argue with that?*
*The conservative liberal coalition
@Gary
The willingness to reply has vanished
I tried
But your cynicism wrapped in the language of the consultant – knowing nothing and delivering less – vaporised it
@Richard Murphy
From the ECB conclusion into public sector efficiency:
“Countries with small public sectors report significantly higher PSE [public sector efficiency] indicators than countries with medium-sized or big public sectors. All these findings suggest diminishing marginal products of higher public spending.
The results that we get from the production-frontier-related FDH analysis, which uses the PSP indicators, are also in line with the aforementioned conclusions. Small governments tend to show better results. Spending in big governments could be, on average, about 35 per cent lower to attain the same public sector performance. The
calculations also point out that EU 15 countries show relatively low public sector efficiency when compared with the US and also the average of the other OECD countries in the sample. EU 15 countries are using 27 per cent more public spending than the “most efficient” countries with similar PSP indicators. Spending for the average of the other OECD countries is “only” 11 percent higher than necessary.”
They are careful to stress that the finding is provisional, and it was done in 2003, but it does suggest the link between more funding and better services is a given.
http://www.ecb.int/pub/pdf/scpwps/ecbwp242.pdf
@Gary
The last paragraph is abviously missing one very important word. It should read:
“They are careful to stress that the finding is provisional, and it was done in 2003, but it does suggest the link between more funding and better services is NOT a given.”
I’m sure Freud would love that little slip…
[…] note Gary, my regular commentator from PWC, is commenting tonight on public sector productivity and how it, supposedly declines as the scale of state sector spending […]
[…] note Gary, my regular commentator from PWC, is commenting tonight on public sector productivity and how it, supposedly declines as the scale of state sector spending […]
Gary, hasn’t it been understood for 70 years, that during an economic downturn, the alternative to increased public spending isn’t increased private sector spending; it’s less spending all round? Small differences in efficiency (which are all the ECB paper identifies) are, at this point in the economic cycle, not really the point.
@Marc Daniels
Mark, our entry point into this debate with Richard’s assertion that more taxes would deliver better public services, and that cutting back on funding of these services would necessarily lead to a reduction in the quality of service we recieve.
I was posting data from WB, ECB. Kings Fund, etc which to my mind suggested the link wasn’t so obvious.
It may or may not be true that public spending has a role in managing economic cycles, but that’s not the debate we were having.
PS: I am speaking in a personal capacity, not on behalf of my employer who may not share my views, etc etc
@Gary Taylor
We’re having a debate – not sticking to the terms of the engagement letter
Do you want a fee to change them?
Is that your problem?