I wrote the following last July, but it seems apposite to repost it now:
The UK government has proposed increasing the standard rate of Value Added Tax (VAT) from 17.5% to 20% from 4 January 2011.
They are not alone in proposing increases in VAT or equivalent taxes to address deficits in government budgets. The States of Jersey currently has a proposal to do much the same thing — increasing their rate of Goods and Services Tax (which is a VAT in all but name) from 3% to 5%. These rises will be contagious.
In this case though there is a curious link between the two proposals. A paper issued by the House of Commons library on this issue and commentary in Jersey on the same issue both rely on work by the Institute for Fiscal Studies to support their claim that any increase in VAT is only mildly regressive at most, or might actually be progressive — as the IFS have claimed.
A new Tax Briefing from Tax Research UK examines that Institute for Fiscal Studies claim and finds it is a statement of political dogma, but not of fact.
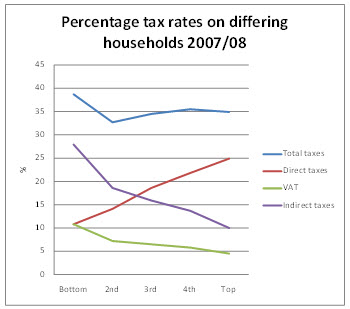
As the Tax Research briefing argues, a regressive tax is almost universally agreed to be one where the proportion of an individual’s income expended on that tax falls as they progress up the income scale. VAT is a regressive tax. This is shown, quite dramatically, in the graph below which is based on UK official data :

By chance the VAT and total direct tax burdens on the bottom 20% of households ranked by their income is the same. Direct taxes then rise steadily as a proportion of income as incomes rise and both VAT and all indirect taxes combined do the exact opposite, falling as a proportion of income as income rises. So marked is the trend that the overall progressive effect of income tax is not enough to counter the fact that the poorest households suffer such a high rate of overall indirect tax that they end up with the highest average tax rates in the economy as a whole.
The message from this data is unambiguous: the poorest 20% of households in the UK have both the highest overall tax burden of any quintile and the highest VAT burden. That VAT burden at 12.1% of their income is more than double that paid by the top quintile, where the VAT burden is 5.9% of income. VAT is, therefore, regressive.
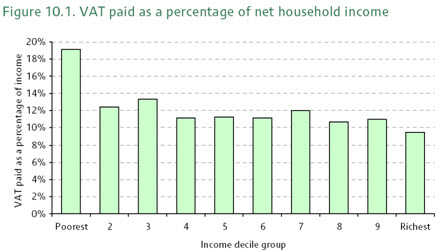
The IFS dispute this. They produce the following data in evidence:

They say of this:
It shows that the percentage of net income paid as VAT varies relatively little across most of the income distribution, with the biggest exception being that the bottom decile group does pay a higher fraction of its net income on VAT than do other income groups.
And they then use this claim to justify the fact that in their opinion VAT paid is not regressive with regard to income.
The slight problem for them is that this overlooks the very obvious fact that it is. Replotting their data and excluding the bottom decile as they would like the following graph can be drawn:

The linear regression shows a clear downward trend that makes very clear VAT is regressive.
Surprisingly the IFS ignore this obvious fact and go on to claim:
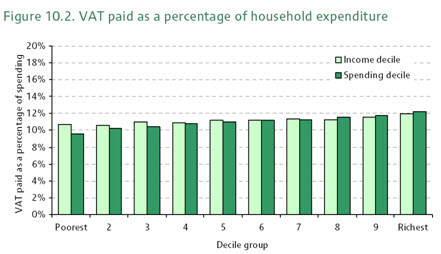
However, looking at a snapshot of the patterns of spending, VAT paid and income in the population at any given moment is misleading, because incomes are volatile and spending can be smoothed through borrowing and saving. Consider a student or a retiree: their current income is likely to be quite low but their lifetime earnings could be relatively high. The student may borrow to fund spending, whilst the retiree may be running down savings. Similarly, many people in the lowest income decile will be temporarily not in paid work and able to maintain relatively high spending in the short period they are out of the labour market. Because their spending is higher than their current income, these people will be paying a high fraction of their current income in VAT. Similarly, those with high current incomes tend to have high saving, and so appear to escape the tax, but they will face it when they come to spend the accumulated savings. Because of this ‘consumption smoothing’, expenditure is probably a better measure of living standards (and households’ perceptions of the level of spending they can sustain).
And they then claim that comparing VAT with spending shows that VAT is progressive:

However, this requires that a number of further conditions hold. First, the poor must have savings, and as I show, they don’t. Second, they must have access to borrowing, and as I show, they don’t (except for doorstep lenders). Third, the consumption patterns of the rich must be the same as the poor, and they’re not. In fact, the consumption patterns of the rich (for school frees, private health, leisure travel, second homes and financial services products) are all VAT free, unlike the consumption patterns of the poorest. In addition, the IFS has to abuse all known notions of measure for progressivity to reach this conclusion.
The result is that far from the IFS claim being justified, it is vey obviously wrong, and very poor quality research. As a matter of fact VAT is regressive.
The IFS claim is, however, consistent with persistent IFS recommendations that VAT be increased (to replace corporation tax, for example, and on food and children’s clothing to pay for “desirable tax reductions”) all of which, together with their recommendations that Inheritance Tax be abolished and tax on interest income be abolished suggest a systematic bias towards making recommendations that favour redistribution of taxes from those who work for a living or who are the poorest in our country towards those with wealth and who enjoy income from capital.
None of which makes it easy to see how the IFS can sustain the claim that it:
maintain a rigorous, scientific approach to research, while offering scope for timely, independent, well-informed contributions to public debate.
The full paper is available here.
http://www.ifs.org.uk/centres/esrcIndex
It is, for example, defined as such in the Oxford Dictionary of Economics.
[ii] http://www.statistics.gov.uk/downloads/theme_social/Taxes-Benefits-2007-2008/Taxes_benefits_0708.pdf
http://www.parliament.uk/briefingpapers/commons/lib/research/briefings/snbt-05620.pdf
http://www.gov.je/SiteCollectionDocuments/Tax%20and%20your%20money/ID%20FSR%20GREEN%20PAPER%2020100621%20MM.pdf
http://www.ifs.org.uk/budgets/gb2009/09chap10.pdf
Thanks for reading this post.
You can share this post on social media of your choice by clicking these icons:
You can subscribe to this blog's daily email here.
And if you would like to support this blog you can, here:


The obvious conclusion to be obtained from all these nice graphs is that a fairer tax system would have a VAT rate of ,say, 25 percent, and an exemption of income tax and NI on the first £20,ooo of household income
@william
Except that is pie in the sky – because the numbers won’t work
@Richard Murphy
which I guess is the point. The starting point (of analysis) for any incremental tax change is its impact on total take. Who actually bears the cost, and who everyone thinks is actually bearing the cost is kind of irrelevant.
@alastair
For a man who has just described me as sick you are remarkably free of ethics
And absolutely wrong – who bears tax is of great significance – as is the distortion in the evidence beloved of neoliberals
I think it’s pretty clear that VAT is generally regressive. More of an issue is that, linked to reduced government spending, it is a pretty direct way to reduce the money supply. Is this really what the government want, especially as they continue to encourage banks to lend and consumers and business to borrow.
The lack of understanding of the fundamentals of our debt-based economy is truly scary.
SNAFU
Richard, if I understand your primary objection to the IFS’s position it is that the progressiveness or otherwise of a tax has to be based on income and not consumption. However the Wikipedia entry for “progressive tax” in the second sentence says “”Progressive” describes a distribution effect on income or expenditure”. VAT is a consumption tax so why wouldn’t you measure its progressiveness in terms of consumption?
@Chris
Candidly you could have just gone in to make it say that
I’d rather something more reliable – try the Oxford Dictionary of Economics – which say a regressive tax is “a tax where the ratio of tax paid to income falls as income rises”
I think that’s significantly more persuasive
This semantic argument about the intended referent of “progressive” is meaningless to real people trying to feed and house themselves.
A conversation about fairness has to be about the distinction between what is essential to staying alive and what is not.
VAT is not and cannot be progressive until basics such as food and heat are excluded. We even have a figure enshrined in law (I presume calculated by the Low Pay Unit or something similar) which is used to calculate benefits, CT relief, etc – and then VAT is paid on goods in those very baskets. This is clearly nonsense at any level whether it’s 1% or 99%.
That is not income OR consumption – it’s about the fraction of your income that is truly “disposable.”
You could now argue that in VAT it’s about the Value Added – but then why have exemptions for essentials at all?
The UK signed up to the treaty of Rome. One consequence being a commitment to alignment of VAT rates in the EU (within 3% ?). As such an increase in VAT rate in the UK has been inevitable but the timing of the increase truly sucks ! The UK did well years ago to get the zero rates which are contrary to the EC 6th Directive, which personally takes the edge the increase in the standard rate when it comes to essentials. My kids will be eating jaffa cakes and not chocolate biscuits from now on ! However, Joe publics desire to consume will now be sorely tested in the face of rising prices, rising unemployment and no doubt an increase in interest rates. Why does it feel like we will be entering the worst and longest recession the UK has known? But what really bugs me is the exploitation of the low value import VAT relief. Having lived in Guernsey I know it has been exploited for years and compliance is an issue. I fear for friends in Guernsey who are normal working folk who will have to pay the price for the massive asset inflation and growing public debt over there from a desperate attempt by the Islands leaders to attract business at any cost. Bad Karma ! A silver lining to the dark clouds of the VAT increase is that it is also a tax on financial services and in particular has hit cross border management fees, royalties etc… (used to avoid UK corporation tax) following the change in the reverse charge legislation in the EU in Jan 2010. For those banks which have outsourced UK jobs, this is an unwelcome tax increase. Having said that the banks will try and find a way around the VAT increase (Why are umbrella companies allowed to flourish ? especially some based in the IOM?). My main concern is that it is another blow for charities and the education sector which should be supported as part of this big society thing ! Why do I feel like Im turning into a grumpy old man in my early forties! Happy New Year !
Are benefits included in the figures?
To get a true picture it seems to me that they should be. If you are going to count the tax going out you should also count the tax coming back in in the way of benefits?
Clive has hit a nail on the head. Of course VAT is regressive but what matters is outcomes. A poor person might pay £10 in VAT but if he/she receives £50 in benefits and public goods that is an outcome.
With VAT the rich biggest spenders contribute most cash and it also captures revenues from income tax evaders, avoiders and tourists. No other tax does this as well as VAT. Everyone pays so everyone has an interest in controlling public expenditure.
The UK exemptions business is a nightmare of complexity and cost benefiting bureaucrats and lawyers – monies that could be more productively used to hone the benefits system.
@Craig Leach
As I said to you on Monday night – every assumption you make is wrong
VAT has, according to HMRC, double the avoidance / evasion rate of income tax in the UK
Of course high consumption tax with a very generous benefit system works – but I don’t hear the second part of the message – only the first
In that case you are quite emphatically wrong in all you argue – just as you were to claim business pays GST which is intended to eb a tax ion consumers – but which also just happens to prejudice some small business as well
Richard by not having VAT we lose revenues that come proportionally greater from the richest biggest spenders, plus contributions from the tax avoiders plus evaders plus tourists. Even with a top accountant the rich guy pays VAT on his restaurant bill, those who work the black economy likewise and tourists. A tax that produces contributions from everyone at the right time at the right place and in the agreed amount to use your own terms. You dismiss what seems to me very factual information and i struggle to understand what is wrong with what I have just stated.
@Craig Leach
Because it is regressive!!!!
How many times do I have to say it?
And that is grossly unfair – and you are proposing nothing to remedy that fact
And not, based on your comments last Monday, do you know a great deal about VAT
Sorry – but when you can overcome the massive misunderstanding that seems to be blinding you come back to debate the issue
Right now you’re just saying collecting tax is in itself a good thing
No it isn’t is my answer
How you collect tax is vital too – see http://www.taxresearch.org.uk/Documents/Foundations.pdf
Richard
I have read the article you attached and fully agree with it. I recommend it to your readers. We need to think beyond ‘its a regressive tax how terrible’ to outcomes. Just maybe – and I don’t want you to dismiss the concept out of hand again – a ‘regressive’ tax is necessary to derive contributions from the rich, avoiders, evaders and tourists so that we obtain the funds necessary to deliver proper social services and support to those in need. A tax that can indeed meet the criteria set out in the article. It is not sufficient to say ‘its regressive end of story’.