
The UK government has proposed increasing the standard rate of Value Added Tax (VAT) from 17.5% to 20% from 4 January 2011.
They are not alone in proposing increases in VAT or equivalent taxes to address deficits in government budgets. The States of Jersey currently has a proposal to do much the same thing — increasing their rate of Goods and Services Tax (which is a VAT in all but name) from 3% to 5%. These rises will be contagious.
In this case though there is a curious link between the two proposals. A paper issued by the House of Commons library[i] on this issue and commentary in Jersey on the same issue[ii] both rely on work by the Institute for Fiscal Studies to support their claim that any increase in VAT is only mildly regressive at most, or might actually be progressive — as the IFS have claimed[iii].
A new Tax Briefing from Tax Research UK examines that Institute for Fiscal Studies claim and finds it is a statement of political dogma, but not of fact.
As the Tax Research briefing argues, a regressive tax is almost universally agreed to be one where the proportion of an individual’s income expended on that tax falls as they progress up the income scale[i]. VAT is a regressive tax. This is shown, quite dramatically, in the graph below which is based on UK official data[ii] :
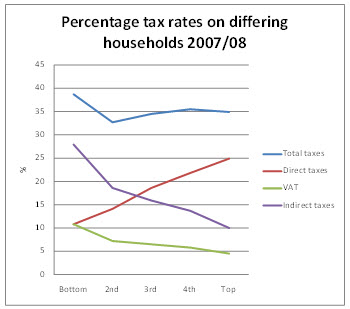
By chance the VAT and total direct tax burdens on the bottom 20% of households ranked by their income is the same. Direct taxes then rise steadily as a proportion of income as incomes rise and both VAT and all indirect taxes combined do the exact opposite, falling as a proportion of income as income rises. So marked is the trend that the overall progressive effect of income tax is not enough to counter the fact that the poorest households suffer such a high rate of overall indirect tax that they end up with the highest average tax rates in the economy as a whole.
The message from this data is unambiguous: the poorest 20% of households in the UK have both the highest overall tax burden of any quintile and the highest VAT burden. That VAT burden at 12.1% of their income is more than double that paid by the top quintile, where the VAT burden is 5.9% of income. VAT is, therefore, regressive.
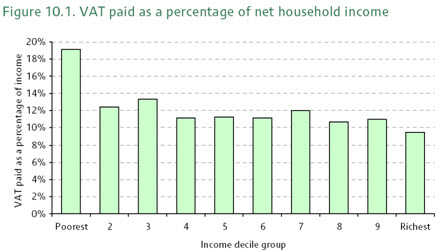
The IFS dispute this. They produce the following data in evidence:
They say of this:
It shows that the percentage of net income paid as VAT varies relatively little across most of the income distribution, with the biggest exception being that the bottom decile group does pay a higher fraction of its net income on VAT than do other income groups.
And they then use this claim to justify the fact that in their opinion VAT paid is not regressive with regard to income.
The slight problem for them is that this overlooks the very obvious fact that it is. Replotting their data and excluding the bottom decile as they would like the following graph can be drawn:

The linear regression shows a clear downward trend that makes very clear VAT is regressive.
Surprisingly the IFS ignore this obvious fact and go on to claim:
However, looking at a snapshot of the patterns of spending, VAT paid and income in the population at any given moment is misleading, because incomes are volatile and spending can be smoothed through borrowing and saving. Consider a student or a retiree: their current income is likely to be quite low but their lifetime earnings could be relatively high. The student may borrow to fund spending, whilst the retiree may be running down savings. Similarly, many people in the lowest income decile will be temporarily not in paid work and able to maintain relatively high spending in the short period they are out of the labour market. Because their spending is higher than their current income, these people will be paying a high fraction of their current income in VAT. Similarly, those with high current incomes tend to have high saving, and so appear to escape the tax, but they will face it when they come to spend the accumulated savings. Because of this ‘consumption smoothing’, expenditure is probably a better measure of living standards (and households’ perceptions of the level of spending they can sustain).
And they then claim that comparing VAT with spending shows that VAT is progressive:
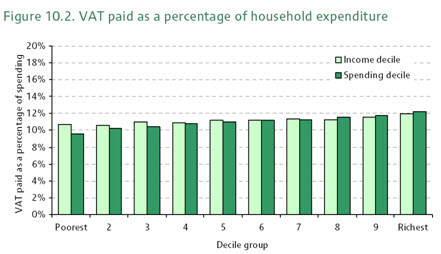
However, this requires that a number of further conditions hold. First, the poor must have savings, and as I show, they don’t. Second, they must have access to borrowing, and as I show, they don’t (except for doorstep lenders). Third, the consumption patterns of the rich must be the same as the poor, and they’re not. In fact, the consumption patterns of the rich (for school frees, private health, leisure travel, second homes and financial services products) are all VAT free, unlike the consumption patterns of the poorest. In addition, the IFS has to abuse all known notions of measure for progressivity to reach this conclusion.
The result is that far from the IFS claim being justified, it is vey obviously wrong, and very poor quality research. As a matter of fact VAT is regressive.
The IFS claim is, however, consistent with persistent IFS recommendations that VAT be increased (to replace corporation tax, for example, and on food and children’s clothing to pay for “desirable tax reductions”) all of which, together with their recommendations that Inheritance Tax be abolished and tax on interest income be abolished suggest a systematic bias towards making recommendations that favour redistribution of taxes from those who work for a living or who are the poorest in our country towards those with wealth and who enjoy income from capital.
None of which makes it easy to see how the IFS can sustain the claim that [i] it:
maintain a rigorous, scientific approach to research, while offering scope for timely, independent, well-informed contributions to public debate.
The full paper is available here.
[i] http://www.ifs.org.uk/centres/esrcIndex
[i] It is, for example, defined as such in the Oxford Dictionary of Economics.
[ii] [ii] http://www.statistics.gov.uk/downloads/theme_social/Taxes-Benefits-2007-2008/Taxes_benefits_0708.pdf
[i] http://www.parliament.uk/briefingpapers/commons/lib/research/briefings/snbt-05620.pdf
[ii] http://www.gov.je/SiteCollectionDocuments/Tax%20and%20your%20money/ID%20FSR%20GREEN%20PAPER%2020100621%20MM.pdf
[iii] http://www.ifs.org.uk/budgets/gb2009/09chap10.pdf
Thanks for reading this post.
You can share this post on social media of your choice by clicking these icons:
You can subscribe to this blog's daily email here.
And if you would like to support this blog you can, here:


“Third, the consumption patterns of the rich must be the same as the poor, and they’re not. In fact, the consumption patterns of the rich (for school frees, private health, leisure travel, second homes and financial services products) are all VAT free, unlike the consumption patterns of the poorest. In addition, the IFS has to abuse all known notions of measure for progressivity to reach this conclusion. ”
Which is flatly contradicted by your graph. The fact is that when the “rich” do spend their money, a higher proportion of it is paid in the form of VAT than the spending by the poor.
If you are going to carp about the absence of VAT on education and health, then you might as well add into the equation not only the cost of education that the “poor” receive from the state, but also the VAT that they avoid on school fees.
@Alex
Your point is very obviously wrong – as mu briefing makes clear.
Debating this is not worthwhile with you though: your contempt for both reason and ordinary people is apparent
Your further comments relating to this post will be subject to the moderation policy and may be deleted at my sole discretion using the right of editorial freedom that all true libertarians respect and seek to preserve.
Richard,
This is not a new discussion.The outcome of the debate depends on how you measure things.Although the better off pay more in VAT in absolute terms, they pay less as a percentage of their annual income. For this reason, VAT has been called a regressive tax. Please note, however, that this is true when measuring an an annual incidence basis. The objection to this “classic” approach in ecomomic circles is that peoples’ incomes fluctuate over time and that tax incidence should be measured over lifetime to determine its true impact. Most people grow their incomes during their careers and enjoy a lower income during retirement. Under the lifecycle incidence approach, a VAT is proportional for most people. The exceptions are the very rich and the very poor, that are those who are unable to realize socio-economic advancement during their lifes.
In other words, for most people, where the poor have to spend all their income and thus pay tax on all income, the better off have the ability to save. Savings are not taxed under aVAT and that is what creates the regressivity. However, for most people savings are postponed consumption. Savings are used for particular purchases (capital goods) and in tetirement or bad times) When all savings are consumed later in life, then the VAT is proportional measured over an individual’s life.
@Robert van Brederode
It may be an old debate but like all neoclassical argument on tax incidence the conclusion that debate reached was contrary to common sense, offensive to decent people, and required assumptions to be made – such as in this case a curious indifference to time – which defy reason .
In other words – it is not just bad social science – it is simple fabrication to suit a political agenda to which the IFS and others subscribe
“First, the poor must have savings, and as I show, they don’t. Second, they must have access to borrowing, and as I show, they don’t”
If both of these are true it must mathematically follow that for the poor (as defined by income) expenditure is lower than net income. And as a result that the maximum proportion of income spent on VAT must be 15% (17.5%/117.5%). In fact well below 15% because a large proportion of expenditure will be on zero rated or exempt goods and services.
Yet Figure 10.1 above shows that 19% of income is spent on VAT for the lowest decile.
Something doesn’t add up, does it?
It is easy to write off VAT increases as a regressive tax and therefore unworthy in a fair system but this is simplistic. A poor person pays out most of their income in housing, utilites, food, interest, clothes most of these are sheltered from a VAT increase. A VAT increase creates much more tax from the wealthly through extravagent purchases. VAT should be at 30% with generous exemptions for basics and we should cut direct taxes so that tax haven abuse becomes secondary. Treat the causes not the symtoms. There are democratic independent states that operate well without income tax at all – the police, fire, government are volunteers. Big taxes are regressive in society as a whole maybe eventually no-one will want to work….
@Peter
You ignore the fact that some benefits are not taxable and are not in income
But that is true for the well off too – me included
The impact is just greater for the poorest
@taxsolver
Please tell me how you think we might have government made up of volunteers?
How do you think this will assist democratic representation?
Or are you seeking to remove democracy?
Is implementing a “national sales tax” or “value added tax” to replace “income tax” a good idea?…
EDIT
Updated with graph to illustrate the regressive nature of VAT.
My back-of-the-envelope suggests for UK this would require a tax rate of ~50%; US rate would be lower but seems unfeasible
Apparently the OECD regards property taxes as the ‘best…