It is often suggested that Labour is profligate and the Toriescare the naturally ‘safe pair of hands' when it comes to running the economy. The Tories, it is presumed, do not borrow as much as Labour. This is a hypothesis I have tested before. I thought it time to update to to the end of the 2019/20 financial year.
The analysis that follows is based on borrowing, as reported by the House of Commons Linbrary and other data supplied by the Office for Budget Responsibility.
The government in office was decided by who was at the end of a financial year.
I then calculated the total net borrowing in Labour and Conservative years and averaged them by the number of years in office. All figures are stated billions of pounds in all the tables that follow and in this case are in original values i.e. in the prices of the periods when they actually occurred:
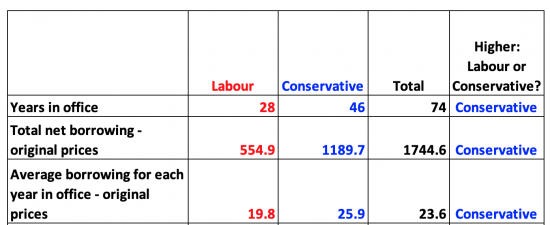
The Conservatives borrowed more, not just absolutely (which is unsurprising as they had more years in office), but on average.
This though, is a bit unfair: the value of money changes over time. So I restated all borrowing in 2019 prices to eliminate the bias this gives rise to. This resulted in the following table:
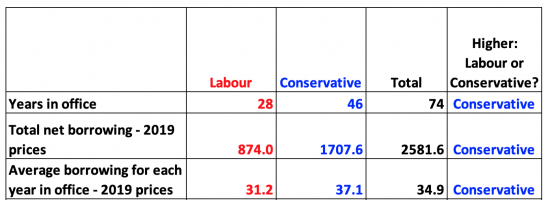
In current prices the Conservatives still borrowed more (much more) overall, and on average, by a long way.
So then I speculated that this may be distorted by events since 2008. That is what the Conservatives would claim, after all: they would say that they have spent six years clearing up Labour's mess. So I took those years out of account and looked at the first 62 years of the sample. First I did this in original prices:
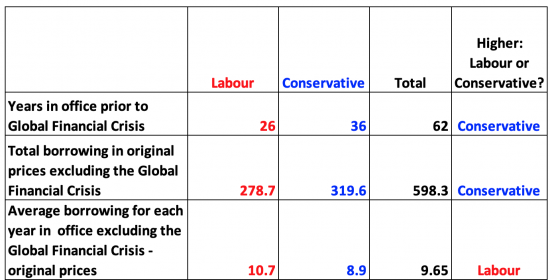
It looked like their claim might stack. So I did it again in 2019 prices:
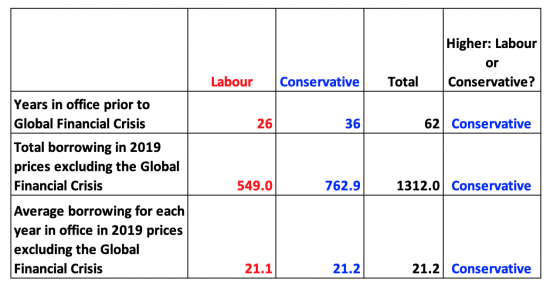
The Conservatives borrowed more, after all, although it was a close run thing.
Then I speculated that this might be because Labour are good Keynesians: maybe they repaid national debt more often than the Conservatives. Or, to put it another way, they actually repaired the roof when the sun was shining. This is the data in terms of number of years:
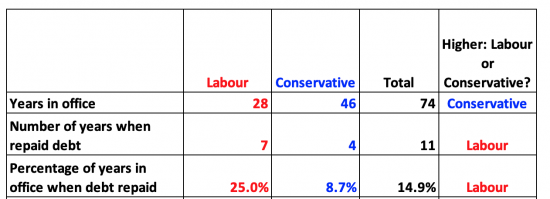
Labour do walk the talk: they repay national debt much more often in absolute and percentage terms than the Conservatives. In fact, one in four Labour years saw debt repaid. That was true in less than one in ten Conservative years.
But maybe the Conservatives repaid more. I checked that. This is the data in both original and 2014 prices:
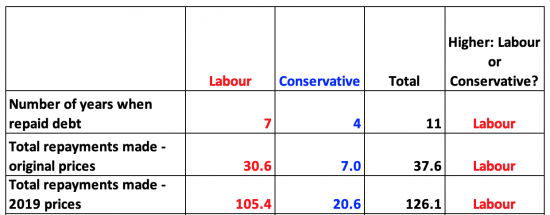
Labour not only repaid more often, it turns out: it also repaid much more in total and on average (not shown) during each year when repayment was made.
So what do we learn? Two essential things, I suggest.
First, Labour borrows less than the Conservatives. The data shows that.
And second, Labour has always repaid debt more often than the Conservatives, and has always repaid more debt, on average.
The trend does not vary however you do the data. I have tried time lagging it for example: it makes no difference.
Or, to put it another way, the Conservatives are the party of high UK borrowing and low debt repayment contrary to all popular belief.
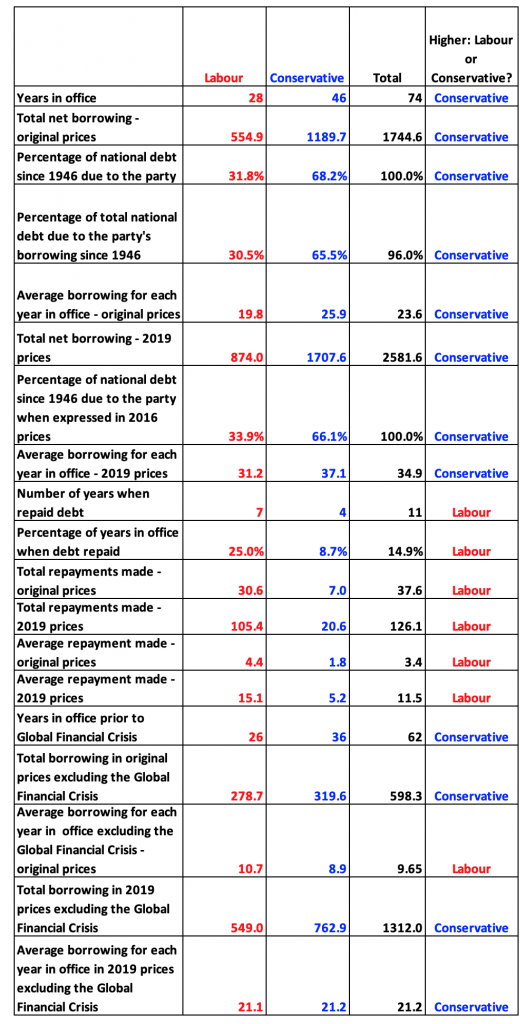
For those interested, this is the overall summary table: the pattern in the right hand column is really quite surprising:
Data sources
The basic data on borrowing came from the House of Commons Library. This data is updated over time: figures will differ from earlier versions of this blog.
All other data comes from the Office for Budget Responsibility
Thanks for reading this post.
You can share this post on social media of your choice by clicking these icons:
There are links to this blog's glossary in the above post that explain technical terms used in it. Follow them for more explanations.
You can subscribe to this blog's daily email here.
And if you would like to support this blog you can, here:

 Buy me a coffee!

I don’t suppose anyone will read this, and if they do it won’t change their voting preferences which are generally a faith-based thing. But I’ve posted it on the off-chance …….
It’s the sort of number crunching that bores me to tears and I am much too lazy to do, so thanks for it.
The first time I posted this it became the best read post in this blog’s history….
I love this analysis….. but my experience is the same as Andy’s – Tories refuse to believe it. There are none as blind as those that cannot see.
This is well known in historical circles, i have known about this since the 90s when i was at university. Thanks for the data and its condensed form. The problem is belief, people just do not believe you when you tell the above, and other stuff about economics. The tories take out the economy which means more unemployed and less tax so they have to “borrow” more. Labour invests in the economy, hence people and more people are able to pay more tax as their wealth and jobs numbers increase. So in the end labour only needs to “borrow” less and are able to “pay the national debt” off more. The problem for labour is they “tax” more and people think it hurts them in their pocket and so believe the tory lines they are better off with them.
Thank you for taking the time to prove what I have always thought.
I have never voted Tory, could not see where they did anything to help working classes. They have always been the party of the elite. This will never change. I just wish more people could read this report and think what it means to them. Higher taxes, more austerity, lower wages etc.
Richard, This is lightly off topic, but I was trying to write something about borrowing this morning. Feel free to dismiss it as nonsense!
Have I got this right?
When Lockdown brought the economy to a halt, massive amounts of apparent money simply disappeared into thin air.
The Government funded its rescue package by creating large amounts of new money out of thin air.
The Government intends to issue bonds to cancel out this thin air money.
But when banks buy these bonds, they will not be paying with existing money.
The banks will use an accounting exercise, creating their own thin air money to buy the bonds.
So that the Government will simply be paying the banks to create new thin air money, which will replace the money that the Government has already created.
Why?
The way that lockdown caused the disappearance of money, was through halting the circulation of money within the economy.
The Government recovery strategy will be to introduce pay freezes and reduce public spending, thus reducing the circulation of money.
Consider a formerly profitable restaurant. It paid wages, paid rent, and bought consumables. This stopped overnight with lockdown. When lockdown ends, government strategy appears to reduce the amount of money available to customers that they would need in order to start using the restaurant again.
Why?
Treating the illness by maintaining a permanent form of the disease.
Actually, bonds can be bought with transfers….
There are financial flows which do not create new money but transfer the claims on money
This needs work, but it changes this narrative
I will get to it
Yes you are right and so is the OP, the money that is used to pay for the bonds was created by the banks or the bank of england at one time as ” new money”. Of course i amnot saying it was created at the time of covid 19 crisis but a point in time.
Richard – I accept that I may be out of date or misunderstood and I may have got some of the language wrong (economics really is not my area of expertise) but my understanding is that unlike the financial crisis QE in 2008 the government has this time cut the clearing banks out of the loop by ‘borrowing’ directly from the Bank of England (their own bank) so in reality they currently only really owe the money to themselves so it could be left to lie on the books for a while before being effectively just written off at no real cost to either the economy or the general population. I would have thought that involving the clearing banks at this stage of the game would be a retrograde (plain and simple stupid) thing to do.
I can’t really envisage that this bailout money is going to lead to inflation so the main worry of printing money doesn’t really apply here. Although they’ve lost the tool of using interest rates to slow things down money can always be taken out of the economy in the future via taxation if it should become necessary.
Government’s investment in the economy, infrasture and productivity seems to create an almost virtues circle. I accept that this bailout is not quite the same but saving the economy should also have a similar virtues effect especially when compared to the alternative of not having an economy and mass unemployment
Why would you involve the banks and therefore create a debt where one doesn’t really exist, unless you count owing yourself money as a debt.
Whilst I appreciate that the US is in a different position because of the primary position of their currency I really can’t see the US going through austerity to pointlessly pay back a debt to their own central bank.
Have I got this completely wrong?
I suspect they will do QE even though they do not need to do so
Why? Because it adds flexibility to timing, that’s all
Just for the record:
* Last time: https://www.taxresearch.org.uk/Blog/2017/11/27/the-tories-created-two-thirds-of-the-uks-national-debt/
* And before: http://www.taxresearch.org.uk/Blog/2016/03/13/the-conservatives-have-been-the-biggest-borrowers-over-the-last-70-years/
* And also: https://www.taxresearch.org.uk/Blog/2016/12/28/the-conservatives-have-out-borrowed-labour-for-a-century/
Well, unlike 2017, you have left the future projections out this time, which is a good thing.
You have allocated borrowing during a year to the party in power at the end of that year. I suspect it might not make too much difference, but most elections are in the middle of the year (May/June) so perhaps half (perhaps more) of the borrowing that year will be allocated to the wrong party. So for example all of the 1979 and 2010 borrowing will be labelled as Conservative, but all of the 1997 borrowing as Labour. It is worse when the government changed in October (1951, 1964). Is some pro-rating possible? Alternatively, perhaps leaving out the handful of election years when the government changed (1945, 1951, 1964, 1970, 1974, 1979, 1997, 2010), which would also have the benefit of leaving out borrowing for projects of the losing government which were already under way and hard to change immediately.
I tried such things – and they made not an iota of difference
Restating of national statistics does – line changed for that reason alone
Good to hear the analysis is not sensitive to that sort of detail (and I see some other people asking other methodological questions). Have you published anything along these lines in an economics journal?
No
Far too practical to go in anything like that
To be published in an economic journal you have to be deeply esoteric, and as Sanny Blanchflower would put it, most interested in adding a comma to someone’s previous sentence that was unadorned with punctuation.
Robert,
Somehow I just had a feeling you had a beard. Thank for the big long report.
As someone esle here suggests this may not actually show that Tories are more profligate by choice but that they do more harm to the economy and so have to borrow more to cover the natural stabilsiers in the economy as unemployment rises and tax reciepts fall.
Another factor may be that Labour governments tend to be more sensitive to being called profligate with the nations money and so tend to try not to do that(Gordon “Prudence” Brown in comes ot mind) ,wereas everyone tends to assume a Tory government will be more thrifty so they can get away with not being so .And no one really bothers to check that their biases are incorrect.
This is very weak analysis, something I might expect an A-level student to perform.
One could equally hypothesise that Conservative governments tend to leave the economy in better shape than Labour ones. This was certainly the case in 1997, and the long post-Black Wednesday upswing did allow Labour to pay down the debt in the early Blair years.
I also do not understand your use of borrowing as a proxy for profligacy, not least because you often claim that borrowing doesn’t matter and in fact should be increased (it seems odd to make a party political point which actually favours the party you like the least, but there you go…).
A far better proxy for profligacy is government spending, because ultimately all government spending is paid for by taxpayers, whether through taxes (current taxpayers), borrowing (future taxpayers) or inflation (everyone).
This is why the supposed “deficit” of government spending over tax receipts is irrelevant. What matters is the figure for government spending – that is what will be paid for in the end.
First, your analysis of who pays is wrong. You really are in a time warp.
Second, since debate has been in deficits looking at deficits and debt is not wrong.
Third, you really can’t make the claim that Labour always gains from Tory compoetence when Tories have been in office most of the time – and according to your thesis only lose office when things are going right. That’s ridiculous.
I’m sorry – but this may be simplistic, and it is, but it’s also powerfully illustrative – and all your comment says is that you do not like the facts
This just shows the power of propaganda and how captured our society has become. I imagine its very similar in the US who have the same problems. Would be very interesting to do a multidimensional of different government policy indicators to economic indicators to get down to the source of these differences beyond just the rosette colour of whose in power.
This is really useful info Richard, I think most though would not use December year end but rather the duration for each government. This, for 1946 to 2020 inclusive gives Lab 29 years (5+6+5+13) and Cons 45 (13+4+18+10) which would also affect averages. I assume The Parliamentary Library are ignoring 45 for its dislocation effect, not being real government!
I accept that the methodology can be revised
But I think you’ll still get the same results – I have tried before now and found it made no difference
I listened to Paul Krugman at the tail end of lat year make the self same observation of the Republican Party record in the. U.S. Soaring government deficits whilst proselytising about ,”Balanced books”. Might be interesting (clearly for somebody other than me!) to make the transatlantic comparison.
Would you please be so kind as to provide a little information. What inflation index did you use to create this, and could you list which years you’re allocating to which parties?
My own work has labour having one more year and the conservatives one less…
Party in power at end of the financial year (if I recall correctly: I did that some time ago)
The i=ndex used was the OBR / Treasury GDP deflator
About the OBR / Treasury GDP deflator – I can only find that starting in 1949 . What values are you using for 1946-1949?
Thanks
Imputed based on average change over the following few years
Immaterial t the outcome and so reasonable I decided
Thank you for this piece of analysis. It made interesting reading and if you are in the business of creating a headline it might be if some interest. The Momentum activists in the Labour party have recently created some noise claiming that the Tories “murdered” 100000 people as a result of the period of “austerity” . That is wrong and mendacious in the same way as this analysis is simplistic and designed to prove a political point without context.
Since the financial crash in 2008 the Tories have been in and during this time government debt or borrowing has grown from around 60% of god to circa 80 % simplistically this supports your hypothesis. However by ringfencing healthsocual care and education the cuts required to reduce the deficit were in the order of 20% across the balancing departments. Even thus was insufficent to cover a deficit of £300 bn per annum. So the govt relied on borrowing, to balance the government finances.it has subsequently relied on economic growth and limited tax rises reduce the dependence on government borrowing. So this is a case of the Tory government having to massively increase borrowing to correct finances as a result of the double whammy of the previous labour governments overspending and the consequences of an adverse economic climate
Hence your analysis needs to overlay the economic growth rates and the economic cycle to have any real meaning. Without this it has no context.
You also take no account of off Balance sheet financing by for example the last labour government. This was not counted in the government spend analysis but totalled well over 1 billion of additional borrowing.
In summary this a bit too simplistic , and would not stand critical review were it to be published widely
This is, politely, drivel
There has never been a deficit of £300 bn a year, until now
Labour did not overspend. In fact it repaid debt for four years between 1997 and 2010
And the crash was not created by it – the roots were all in the US
And the off balance sheet financing was created by and continued by the Tories
So with respect, it would seem you got nothing right
In which case you rather wasted your time
Please don’t waste mine again
Oh, and austerity did kill: more than coronavirus, so far