
This is the second part of the republication of my analysis of Lord Alan Milburn's report for the government on young people Not in Employment, Education or Training (NEETs) issued in May 2026.
The first part is here.
In this post, I argue that, based on data analysis, the government is misconstruing the employment problem for young people.
The publication this week of Alan Milburn's interim report on young people and work has generated the usual wave of apparent alarm in our media in reaction to the claim that there are nearly one million young people not in education, employment or training (NEET) at present.
This, it is said, creates a next generation which is at risk. It is claimed that this is a national crisis. And the government, we are being told, must act now.
I have heard all that, but I have to say my immediate, instinctive reaction to the claims was that none of them made much sense, at least in a historical context where what is being claimed to be exceptional actually appears to be normal and unexceptional.
As a result, I have been working through the underlying data on this issue, building up a picture from first principles. And while I do not, in any way, want to minimise the real difficulties facing many young people, I think the NEET framing that Labour appears to have chosen to focus upon misleads more than it illuminates. The numbers, if read properly, do, in my opinion, tell a rather different story that points to the need to address a quite different set of policy priorities. The real question is not, then, just why there is a NEET problem, but why is this the particular issue Labour is choosing to highlight when there might be bigger ones requiring attention?
Let me explain what I did and what I found.
What I did and how
The starting point for what I have done was Milburn's report, which contains a chart (its Figure 1) showing the UK NEET rate for 16 to 24-year-olds from 2001 to 2025, drawn from the Labour Force Survey. I extracted the key data points cited in the text and reconstructed the annual series.
Chart 1: UK NEET rate, 16–24 year olds, 2000–2025
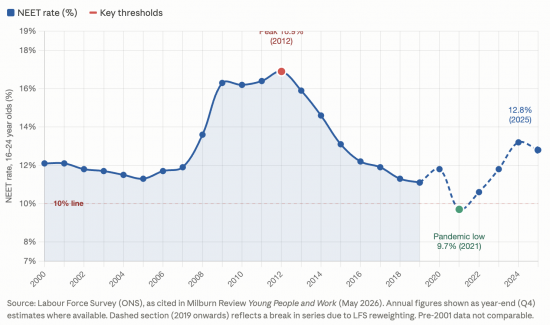
The first thing that struck me was how persistent this NEET rate has been at or about current levels, although it peaked in the aftermath of the financial crisis at 16.9% in 2012. Then the pandemic produced a misleading dip because furlough artificially suppressed unemployment, and not because more young people were in work or learning. But aside from those two distortions, the rate has moved within a remarkably narrow band. For most of the past twenty-five years, it has sat between 11% and 13%. Today it is at around 12.8% if Office for National Statistics data on this issue is right, which, even they admit, is a massive assumption to make, given how unreliable their employment data has been in recent years. We do not, then, have a current crisis in any meaningful sense of that word. Nor is there any significant upward trend in this data that can be meaningfully extrapolated from recent very short-run variations, although that is what reports are suggesting. The current NEET rate is, in fact, close to the long-run norm.
The population behind the rate
My curiosity, however, was not satisfied by discovering this. To understand what the NEET rate actually means in terms of people, you need to know how many 16 to 24-year-olds there are. So the next step was to plot the size of that cohort to help understand trends within it.
Chart 2: UK population aged 16–24, 2000–2025

The cohort peaked in 2012, the same year the NEET rate peaked. The two events are, of course, related. High levels of young people in the population inevitably lead to a high NEET rate. Any policy will always impact this group first if they are disproportionately large in the population as a whole.
Since then, the number in this group has fallen and then partially risen again, but not to its former high levels.
Going back to births
To understand this, I went back to the UK live births series, which runs from 1976.
Chart 3: UK births 1976 to 2025

The pattern here is striking. The baby boom of the late 1980s and early 1990s fed through into a large 16 to 24-year-old cohort in the 2000s and early 2010s, giving rise to the 2012 peak seen in previous charts. A second surge in births during the mid-2000s through to 2012 produced the cohort that is now working its way through the 16 to 24 bracket and will continue to do so until the late 2020s. After 2012, births fell sharply and have continued falling. The provisional 2025 figure, at around 662,000 for the UK, is the lowest since records began in 1976. The total fertility rate in England and Wales has fallen to 1.39 — a record low, and well below the 2.1 replacement level.
Predicting the 16 to 24-year-old population from births
Because the relationship between births and the 16 to 24 age group is mechanically simple, because you just sum the birth cohorts from sixteen to twenty-four years earlier, the birth data gives us a near-certain forecast of how large the youth cohort will be in the coming years. Assuming no deaths (which is a reasonable approximation for this age group, where mortality rates are low) we get this chart, in which I comapre forecast and actual data plus NEET trends, using a right hand axis for NEET data.
Chart 4: Predicted 16–24 population from births (+ 1m migration) vs ONS actual, 2000–2025
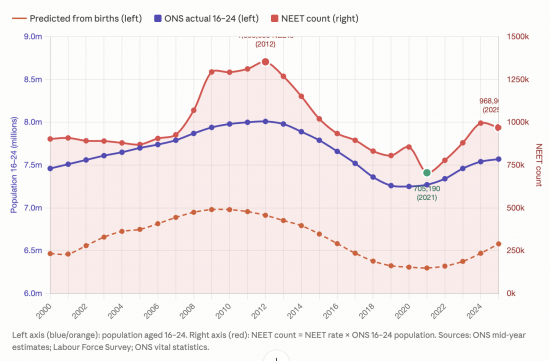
The forecast and actual data track each other well. The actual data closely predicts the NEET rate in actual number terms.
The consistent migration effect should be noted: over the whole period, there are around 1 million more young people than births predicted. They came to the UK as children or young people. There is no broad change in that figure over the whole period.
This then let me forecast, using the birth-based prediction plus the one million uplift trends in population in coming years, plus likely NEET rates. This chart of the 16 to 24 population and the NEET count, both actual to 2025 and forecast to 2035, gives us the clearest view of where we are heading.
Chart 5: 16–24 population and NEET count, actual 2000–2025, forecast 2026–2035
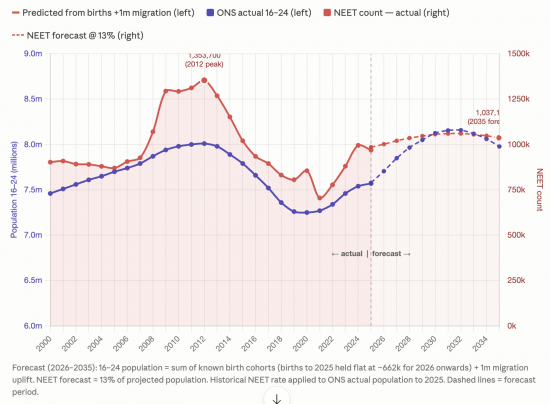
The forecast is built on a simple and transparent assumption: that the NEET rate stays flat at its current level of around 13%, which is also a consistent data point throughout the period looked at. Apply that to the projected population, and you get the forecast NEET count.
What does this data show?
The forecast shows that the number of NEETs will rise for a few more years, but not because the rate or issue is worsening, but because the cohort is growing as the larger birth years of 2008 to 2014 move through the 16 to 24 window. But the rise is modest, and it goes into reverse from around 2030 as those cohorts age out and are replaced by the much smaller birth cohorts of the early 2020s. By the mid-2030s the 16 to 24 population will be falling, and with it, at a constant rate, the absolute number of NEETs.
So is there really a crisis?
Let me be clear about what this analysis does and does not show.
It does not show that the situation facing young people in Britain is comfortable or acceptable. A NEET rate of 12 to 13%, meaning one in eight young people are outside education, employment and training, is not something to be relaxed about.
The Milburn report is right that too many of those young people are experiencing health-related inactivity, that the system fails them, and that the structural problems are real, although, as I have noted this morning, it does not point out that UK youth unemployment is also a deliberate feature of UK monetary policy that the Bank of England is tasked with delivering.
But the framing of an escalating crisis in NEET numbers does not withstand close demographic scrutiny. The rate is not rising significantly. The absolute numbers will rise for a few years simply because the cohort is growing, but that is a mechanical demographic effect, not a policy failure. And by the 2030s, as the low-birth cohorts of the early 2020s come of age, the numbers will fall back regardless of what policy does.
If we are looking for a genuine, structural, worsening problem for young people in Britain, I would suggest that this data shows that we are looking in the wrong place.
The real issue: insecurity within work
The NEET measure captures only those outside education, employment and training. It says nothing about the quality of the employment that young people do manage to find. And here the picture is genuinely alarming.
Young workers in Britain are disproportionately concentrated in the sectors and contracts that offer the least security: zero-hours arrangements, gig economy platforms, short-term agency work, part-time roles that cannot sustain independent living.
At the same time, the collapse in apprenticeship starts, which are down by more than 40% according to the Milburn report, means fewer young people are entering structured, skill-building employment of the kind that historically provided a ladder.
The traditional Saturday job in retail and hospitality that provided work experience has also largely disappeared, and many entry-level roles have been automated or made conditional on experience that a young person cannot by definition already have.
As the Milburn report notes, it is striking that nearly 30% of NEETs have good GCSEs or higher qualifications. The issue is that the labour market is failing to absorb them, and not that they lack credentials. It is not their fault that the structure of the employment market has changed. Good qualifications now offer less protection against insecure, low-wage, zero-hours work than they once did.
What we face, in other words, is not primarily a NEET crisis. We face a youth employment quality crisis. We face a situation where being nominally in employment provides far less security, income, skill development and progression than it once did. That is not captured in the NEET statistics at all. A young person on a zero-hours contract in a warehouse, earning too little to afford their own home and with no prospect of advancement, is counted as employed. They do not appear in the NEET numbers. But their situation is arguably worse by being more invisible, and simultaneously more structurally entrenched, than someone who is NEET and at least visible to the support system.
What the government should really be asking
The Milburn review is not wrong to document the failure of health services, welfare systems and education pathways to support young people into participation. Those failures are real and documented. But by framing the entire exercise around the NEET measure, there is a risk that the policy response focuses on moving young people off the NEET count rather than improving the actual quality of their lives, and both matter.
The questions that deserve more urgency are these:
- Why has the youth share of the labour market declined even as overall employment increased?
- Why have apprenticeship starts collapsed?
- Why are so many entry-level roles now accessed through automated recruitment systems that screen out inexperienced young workers before any human has looked at them?
- Why has the housing market made financial independence impossible for most young workers in high-demand areas?
- And why are the forms of employment most available to young people, such as gig work, zero-hours contracts, and agency work, precisely those that offer the least protection, the least skill development and the least pathway to security?
These are questions about the structure of the labour market itself. They require answers that go well beyond the welfare, health and education reforms that Milburn's diagnosis, however accurate, tends to suggest.
They require thinking about:
- labour market regulation,
- employer incentives,
- the role of trade unions in sectors where young people actually work, and
- the relationship between housing costs and the viability of low-wage employment.
The NEET numbers will largely take care of themselves as the demography shifts, as I show. In that case, to focus on this issue alone is a distraction. The insecurity that young workers face within employment will not be going away anytime soon, and it is on that issue that focus is really required.
Methodology
This analysis was produced using publicly available data from the Office for National Statistics, the Labour Force Survey, and the Milburn interim report on Young People and Work (May 2026).
The charts described in this piece were produced from ONS vital statistics, mid-year population estimates and Labour Force Survey NEET data. All projections use known birth cohort data to 2025 with post-2025 births held at the 2025 provisional figure of approximately 662,000, plus a one million migration uplift applied to reflect the consistent immigration effect observed in the 16–24 ONS population series. The NEET forecast applies a flat 13% rate — approximately the current level — to the projected population. No mortality adjustment is made, as child and young adult mortality rates in the UK are sufficiently low that their exclusion does not materially affect the projection.
Claude AI was used ot assist data presentation used here.
Thanks for reading this post.
You can share this post on social media of your choice by clicking these icons:
There are links to this blog's glossary in the above post that explain technical terms used in it. Follow them for more explanations.
You can subscribe to this blog's daily email here.
And if you would like to support this blog you can, here:

 Buy me a coffee!


I trust and hope that people with some influence in gov will read this and act upon it. I’d especially like to see policies directed towards creating many more craft apprenticeships especially in the building trades, which might help to solve an availabilty of housing crisis. I see no reason why young people seeking a career as a bricklayer, joiner, or electrician should not be starting an apprenticeship on a current rate of national living wage employed by a firm who receive a substantial amount to cover their training costs, employer’s NI, holiday and sick pay etc.
That,in itself, might go a long way to encourage young people into work while providing the country with a future skilled workforce. It’s back to the future as far as I can see. 1960s all over again.
Awesome, Prof.
The only agenda in FtF is finding the most truthful data-story.
Methinks the media and political class are stoking hate towards unemployed welfare claimants to justify shrinking welfare claims in preparation for an increase in unemployment- the billionaire corporations have less need workers,
that’s their agenda demonisation of those most affected by the deliberate deindustrialised managed decline.
Thank you.
Thanks for an article which exposes the recent and current set up of “our” anti-democratic cartel political party model and the political party and main stream media cartel collusion which controls “our” national governance.
”Mainstream governing parties in advanced democracies transition from competing for distinct ideological visions to colluding with one another and the state to protect their shared power and resources.”
”Instead of competing over major ideological orstructural policies, main stream parties cooperate to manage the state, sharing the spoils of office rather than restricting them to the temporary election winner.” (Both from AI Overview)
And such is only possible because the main stream media, including the B. B. C, choose not to point out this collusion and to promote “shared” policies.
It’s interesting isn’t it that the government has chosen to pick on the youngest of us. I mean, people are not even mentioning the parents.
We like many parents have cajoled and encouraged ours to get out there and try things. But how many of these kids don’t even have that for some reason or other?
You are right to be angry and I share it. It’s shameful behaviour.
In the days when it was entirely acceptable for me to be drunk at lunchtime (in Manchester, I was 21). We visited the Castlefield site to find a young man dressed as a Roman centurion stood in the rain ‘guarding’ the attraction. We had a little chat and he revealed that he was on a Community Program and thus far dressing up and standing in the rain was the only ‘training’ that he had received.
Is something similar fated for our Neets?
Probably
There is a fascinating social documentary crying out to be produced which would track down folk like your young Centurion and establish just how life changing that “work experience” was. Judging by the many people I have met who were subjected to National Service, I suspect not a lot.
It’s amazing that it isn’t compulsory for an analysis like this to appear in government reports. Surely it’s the sort of thing the ONS should do…
Spot on, sir. Some remarks in the House today suggest there’s already awareness of this in and around Government. Not for the first time, a queue is forming at your door.
Terrific analysis. Yes why didn’t the report authors check for cohort size effects?
With 4.5 million children living in poverty in the UK we shouldn’t be surprised that this affects their progress in school, their mental health, and preparedness for adulthood.
One of the researchers contributing to Milburn’s report acknowledges this:
https://www.theguardian.com/commentisfree/2026/nov/18/neet-childhood-neglect-needs-mental-health-milburn-review-britain
Clearly stated formal Assumptions List including terms used is needed by the government – where is it?.
You point to a fundamentally important one regarding the nature of the term “employment” itself.
Incorrect inflexible discrete categorisation is ultra-important in this debate. As you state: ” A young person on a zero-hours contract in a warehouse, earning too little to afford their own home and with no prospect of advancement, is counted as employed. They do not appear in the NEET numbers.”
This reminded me of the Life of Brian where Michael Palin pleasantly ticks off his list of those in the queue for crucifixion…
http://www.youtube.com/watch?v=arwZcw0Ejcc