
Britain is supposedly facing a welfare spending crisis. Politicians, newspapers and television commentators are demanding cuts to benefits because they claim that the country can no longer afford its social security system.
But what if the crisis they describe does not actually exist?
In this video, I examine the UK government's own figures for social security spending since World War II. They tell a very different story from the one we are being sold.
Yes, spending has increased in cash terms. But inflation explains much of that apparent increase. And, when we compare social security spending with GDP and total government expenditure, the supposed crisis largely disappears. Nothing justifies the claims that spending is now heading out of control.
The biggest long-term increase has been in state pensions, but that simply reflects a growing and ageing population. We always knew that would happen.
Meanwhile, support for unemployed people, children and low-income families has been squeezed. And whilst disability and sickness payments have increased, the figures need to be understood in their historical and economic context.
So why are politicians demanding further cuts?
I argue that this is not really about controlling spending. It is about scapegoating people who need support, while refusing to acknowledge the failures of an economy that increasingly excludes those who cannot fit its demands.
This is an economic argument by those who make it, but it is also a profoundly moral one.
My argumemnt is that we should be asking how to provide everyone with dignity and security, and not how to make vulnerable people poorer. If we have a crisis, it is because too many people just do not care. That is the issue we really need to face.
This is the audio version:
This is the transcript:
Over the last week or so, we have heard numerous attacks on what is called the ‘Welfare Budget', but which I like to call the ‘Social Security Budget' of the UK government.
The attacks have come from Kemi Badenoch, as leader of the opposition, who wants this budget cut. It seems that every newspaper and every television commentator shares the view. I've heard Channel 4 challenge Labour ministers on cutting welfare, as they call it. ITN has been doing the same. It's everywhere.
The claim is that we must cut benefits. But why? Why, at this moment, is it apparently so desperate for the government to set out to make the poorest people in our economy very much harder up? That's the question I want to ask, and I will tell you now: there is no logical answer to that question. The data doesn't support the demand.
Let's look at this chart.

I've created the charts in this video from data published by the government on welfare spending, as people now like to call it, but social security spending, as I insisted, is from 1946 onwards. The data is available, published by the government, and this is from their latest publication.
And what it shows is the expenditure on the various headings that make up the total social security budget, plus those that are forecast, but that does not include the latest budget projections: it includes those projected a year ago, but which were known to the government at the time that this particular forecast was prepared.
And the point is, when we look at the right-hand side of this chart in that grey forecast zone, it looks as though expenditure is rising, and quite steeply. And that seems to me to be the reason why we have this paranoia at the moment about the fact that welfare spending is going to rise from a figure of a bit over £300 billion a year at present to something a little less than £400 billion by 2030/31.
Now, the fact is, this does not represent the true picture. There is inflation in this chart. It's obvious that there is.
Of course, there was spending on unemployment benefits and support for families and so many other things in the 1950s and 1960s and even into the 1970s. I can remember my mother going with what was called the ‘Family Allowance Book' to the post office to claim the money for me and my brothers when we were very young. There was a payment at that time. My family benefited from it. But the figure hardly appears on this chart, and the reason why is inflation. And our politicians and our commentators are all being confused by this fact.
Now, let's look at this second chart, which shows social security spending by purpose, as a percentage of GDP.
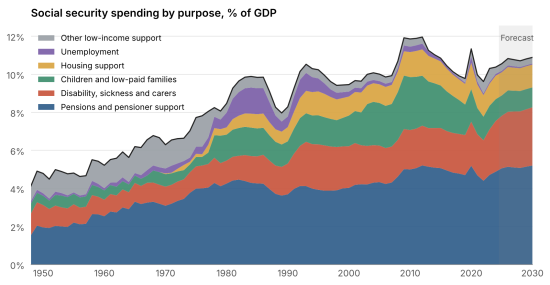
And this chart is important. There are some odd bumps in here, but overall, let's look at the trend.
The odd bumps include the period from 2008 to 2011, when, of course, GDP was depressed by the fact that we had the global financial crisis. There's another bump in 2020. Why? Because GDP was depressed again, and that time it was because of COVID.
But if we look at the overall trend of payments since around 1990, when it was quite high, and that was because of unemployment and a recession at that time, there has been a very slow trend upwards at best. And what is that explained by? That is explained by the bulky blue part of this whole chart, which is pensions.
Pensions have risen. They're going to rise. That's because there are more baby boomers in retirement than there have ever been retirees before, and the cost of them is going up. But that is the influence on the forecast.
Now look at that forecast in proportion to GDP.

It's a very small increase at most. There is no crisis with social security spending in this country at this moment. The evidence does not support any suggestion that there is.
Look at this figure again. This time it's been redrawn. This time it's drawn as its percentage of total government spending. And there are some strange phenomena in here, which I will look at in detail in a moment. But again, actually here we see that pensions are not rising dramatically as a proportion of total government spending. It is true that the orange section, disability, sickness, and carers, is growing, but only to levels previously seen, with nothing exceptional overall. And the forecast is for a level of spending as a proportion of total government costs, lower than those from 1990 until the late 2010s. The point is: there is no crisis.
But there has been a very real change in the levels of expenditure. And that is what this chart of those types of expenditure, shown cumulatively on the previous charts, demonstrates.
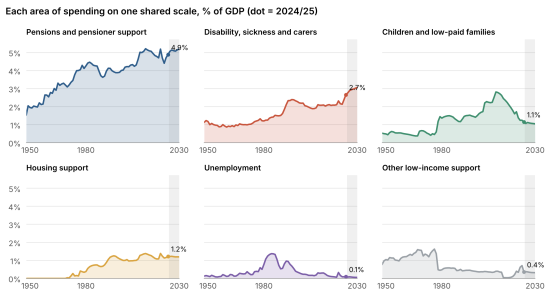
The cost of pensions in the UK as a proportion of GDP has risen. We're talking about from 1946 again, right up to date. And the point is that if we look at pensions: in 1950, the total cost of the old-age pension was around 2% of GDP, and now it's heading for around 5% of GDP. Why is that? We live longer, and the retirement age has not increased proportionately to life expectancy. And so we pay people for longer, and people live longer. The consequence is we spend more.
The question we have to ask, then, is: why are all those who are demanding that the social security costs be cut demanding that people who have an old-age pension should live with less? Because that's exactly what they're saying.
And remember that for at least 20% of people on the state old-age pension, that is their total income. They have nothing else to support them. So around £13,000 a year is what they have to live on, and we are seeing politicians demand that they have less.
Now, there are other old-age pensioners like me who also have a private pension or an employer-provided pension as well. And the fact is, yes, I am not totally dependent upon this money, but it was always part of my planning for retirement. And I might still be working now, but this channel does not earn me a great deal of money, let me assure you of that. And the fact is that I am dependent in that sense on the old-age pension as much as most people are. And taking this away would have a material impact upon the well-being of millions of people in the UK.
And let's be clear about it, because there is a multiplier effect if you remove income from pensioners, because they will spend less, and therefore there will be a ripple-through effect, right through the economy, as a consequence of others not receiving the income that they spend; the consequence of cutting this social security spend would be enormous. And this is the one spend above all else which dominates the total Social Security budget. So the question is: why do politicians want to punish our pensioners for simply being alive?
There's one other area where, as you can see, costs are rising. But let's talk about those areas where costs are falling first of all, because I think that matters.
Look at the children and low-paid families section of this chart. It is declining. It is declining considerably. Our generosity to families is simply disappearing. And why? Because Universal Credit has punished families. That was its intention. That is what it has delivered. And as a consequence, the spending on families has gone down. So in a neoliberal world where the family is meant to be the centre of life, we aren't supporting people to live.
We're not supporting those on low incomes either. Just look at that bottom right-hand grey chart and the figure there is tiny. 0.4% of GDP is spent on supporting people on low incomes, whilst our total expenditure on unemployment has crashed.
Margaret Thatcher created that bubble in the middle of the chart. She deliberately created unemployment in the UK to destroy the trade unions, and we paid an enormous price for that in terms of lost industrial capacity, lost social justice and unemployment at the time. She used the gains from North Sea Oil to pay unemployment benefits, and as a consequence, we had no long-term wealth fund, as a result, either. She did so much harm to this country. It's almost impossible to count.
But now we spend just 0.1% of total GDP on people who are unemployed. We basically don't support them at all. So to claim that there are people sitting around doing nothing is just absolutely wrong. People who are unemployed are not supported. They have no choice.
At the same time, the figure to the left of that chart of unemployment is significant. Let's just look at that. Because Margaret Thatcher sold council houses, and they weren't available, we had to provide housing support to private landlords. We didn't supply housing support to tenants of private landlords. We supplied it to the private landlords. The private landlords actually get the payments directly to them. And we're paying 1.2% of GDP to support private landlords so that people can live in their properties, but they gain no benefit. They previously had council houses. Now they have worse, almost invariably, private-sector accommodation, and the landlord is gaining. This is an abuse of the benefit system. The clearest one there is.
So let's go back to the other sector where there is an increase in cost, and that is the chart in the middle of this table on the top row, and that is disability, sickness and carer's payments.
These were around 1% of GDP, or thereabouts, in 1950, when they were more than half of what pensions were, and now they're heading for 2.7%, which is near-enough half of what pensions are going to be.
So there has been no real change. The cost of supporting people with disability and sickness has risen, but that reflects growing old age. Again, there is a bubble in the 1980s that was the consequence of Thatcher. When she was getting desperate about rising unemployment, she began to encourage people in the late 1980s to claim disability benefits instead, so people came off the unemployment register. Her figures looked better, but people were paid disability allowances instead, whatever the name was at the time.
They then stabilise for a period of time, and now they're rising again.
We know why they're rising. We know they have risen post-COVID. We know that young people are one of the major areas of concern here. We know that young people are alienated from the workplace. We know that they are suffering increased levels of diagnoses of autism, ADHD, and other conditions, which indicate that they are actually not able to work. And the fact is: this is not their fault. It's a measure of the changing workplace.
The workplace used to be able to accommodate these people. Now, the jobs that they used to do are not available, and therefore they need support. Don't blame young people. We had an economy that used to support people basically from the age of 16 onwards by providing suitable jobs for everyone. Now you have to be a round peg in a round hole, or else you don't get a job. If you're a square peg and the hole is still round, you are unemployed. You need support. The problem is not with young people. The problem is with the economy.
But we are paying more as a consequence. But in proportion to the historic record, there is nothing odd about what is going on here, and that is the point I'm making.
This final chart just makes clear how poor the level of support now is for children and low-paid families.

The forecast shows that trends are downwards. There is nothing to be squeezed out of that sector of the economy anymore.
They are already in poverty. I've made videos explaining that. Around 40% of people in the UK are, in my opinion, in some form of poverty. 20% are recognised as such. That's 14 million people and 4 million children. There is no further squeezing that can be done here. Those who are demanding cuts can't look to this sector to find them.
So if we go back to the first chart, which shows social security spending by purpose, what we can see is that those who are demanding cuts can't demand it from children. They can't demand it from those who require unemployment benefits because they don't basically get any anymore, unlike times gone past, and we can't demand cuts on low-income support because it's negligible.
There are only two cuts which these people could be demanding. One is to pensions, and I don't think they're going to do that because they have self-interest in this area. So they are demanding that people with disabilities and people who are sick and people who require care support have their services cut.
What we are seeing then is an organised attack on people who need help in our society. This is the ultimate neoliberal agenda. “You must get on with it yourself. You are responsible for your well-being. We are not responsible. If you have disability, that's your fault,” is the message that is being sent by all these commentators, by all these politicians, and no, it is not.
If you can sense that I'm angry about this, it's because I am angry about this. I'm very angry about this, because I hate the idea that we're going to prejudice people through no fault of their own. We're going to force them into poverty and despair, and that is the reality of what these people are demanding. I do not believe that is appropriate. I do not believe the data supports any form of justification for cutting Social Security.
The fact is, and let's go right back to that first chart. The fact is that these people are simply terrified by big numbers. What they don't understand is that if we live in an economy where we have had inflation and where, as a consequence, the value of the pound has fallen, and we continue to have inflation, and as a matter of government policy, we are going to continue to have inflation, that chart, this one of rising costs, is going to be the fact that we're going to evidence when we get the data after the event.
But it doesn't mean, if we go to the other charts looking at spending as a proportion of total GDP, or government spending, that we're actually spending any more in real terms on social security.
So what we are seeing is something that has a name: it's scapegoating. Those who want to keep more of the cake for themselves are scapegoating those who are on benefits, those who get pensions and who depend upon them, and those who have disabilities, sickness, and are in need of care. And they are most definitely scapegoating them and saying, “Their claims are false.”
They're not. They're justified. They're real. The process of getting them is extremely onerous. It's tough to get hold of a Personal Incapacity Payment, for example. And the fact is we should not be subjecting people to this amount of pressure to be able to sustain the lifestyle that is essential if they are to take part in our society.
I am horrified by the behaviour of the commentators and the politicians who demand these cuts. They do not understand the reality of life in the UK. I hope I do.
And if I am correctly understanding life in the UK, I'm correct in saying they are wrong. We need to support people in our society. The only problems we have in our social-security system at present are twofold.
One, we don't pay enough to provide people with the dignity they deserve when they are in need or in old age, or when they have children whom they need to support.
And two, we have a problem with commentators who are either ignorant or callous, and there is no other description of them.
That's what I think. What do you think? There's a poll down below.
Poll
Thanks for reading this post.
You can share this post on social media of your choice by clicking these icons:
There are links to this blog's glossary in the above post that explain technical terms used in it. Follow them for more explanations.
You can subscribe to this blog's daily email here.
And if you would like to support this blog you can, here:

 Buy me a coffee!


I have a comment that I wrote at the weekend but couldn’t post them so saved.
Interesting and informative. Is anyone else speaking about this? Kings Fund, IPPR, Resolution Foundation, etc. If not, why not?
I suspect demographics goes a long way to explain increased support for pensioners. There are just more people of pension age, living for longer. That is not a bad thing, unless you want older people to die more quickly.
I suspect some of the reduced support for children and families reflects reductions in the numbers of children. But cutting from 3% of GDP around 2010 to 1% today is an extreme reallocation of resources away from the young (who are our future) and explains why many lower income families are suffering. With the added burden of student debt you can se me why there is so much despair, which leads to anger.
The increase of benefits for sick and disabled people may to some extent reflect their inability to claim other benefits (another example of people being disabled by barriers in society). And also real need that was previously unmet.
Much to agree with
One thing worth doing for reference, is looking at ‘benefits’ spending across the 27 EU countries and the UK. I came across some figures recently in the shape of a bar chart, showing the % of GDP spent on benefits by all 28 countries. The figures for the EU were from Eurostat and those for UK by the DWP. On this scale the UK was joint third from bottom with 10% of GDP. Top of the list was Finland, with 25% of GDP. I wonder if anyone has told the Finns that their economy should be collapsing very shortly!
You are right.
We are dire.
A good blog post. The trouble is that politicians and commentators seem to think that attacking ‘welfare’ payments is good politics, they appear to consider that anyone claiming a benefit or pension is not contributing to society, unlike the Jim O’Neills of this world who worked in finance so that must be good. Too many of those interviewed on Radio 4 take this line and the number of times presenters of various programmes have said ‘The government lacks money’, ‘the welfare bill is going up’, ‘if we spend more we will have to borrow more’, its pretty well several times a day. The fact is that presenters are not qualified to make such comments and should refrain from doing so. All they do is give a false impression of government spending and costs. They are oblivious to the facts and also appear unaware of the role of multipliers. I often shout at the radio on a regular basis!
I too have a small private pension and some other earnings but the state pension is a crucial element of my income!
Much to agree with
Agreed – the case being built up to make cuts is unconscionable as far as I am concerned and is nothing but a symptom of a really sick political economy. It is also so Neo-liberal, as many will seize upon it hoping that it is someone else who suffers – not them. The group ‘to suffer’ has been identified and the consent to make this happen to them is being manufactured in true Chomsky fashion.
We have to name this behaviour, and this naming and shaming of the ‘others’ (disabled, the ill, those who need support) has to be called out for what it is and it is Fascism – alive and well in our society right now.
What makes me really angry is that it seems to me we have learnt nothing from history and if anything Milan Kundera’s observation that ‘Mans struggle against power is that of memory against forgetting’ was spot on.
Agreed
What disgusts me is, yes, that politicians and commentators are demanding cuts in social security. But, more than that, that they don’t even consider cutting tax benefits for the already wealthy. As you have shown, such cuts could easily redistribute our society’s resources to support those in needs. Why focus on cuts for the weakest, the most in need in our society? The greed of these politicians and commentators, who wish to protect their own wealth at the expense of the disadvantaged disgusts me.
If there is any argument for a crisis at all, the data you give shows a clear timeline of when that crisis started. And it will surprise no one on this blog to see that it coincides almost identically across all sectors (other than pensions) with the introduction of neoliberalism.
I remember back in the mid to late 80’s all the Housing Benefit claimants coming into the office waving Invalidity Benefit books as they had just been moved over to it rather than claiming as unemployed.
You are spot on about housing but a point I might add about Disability benefits (again!) and it would be interesting to hear Jacqueline’s opinion is based on my experiences there seem to be lot of people ‘not well enough to work but not sick enough to be treated’ and in the same way that we had ‘Bed Blocking’ due to lack of money for social care we now have a similar situation with benefits.
I also wonder of we need either some sort of ‘cost recovery’ from employers that have a high percentage of low paid workers or restrictions on the payments to shareholders and management salaries.
Finally there is clearly a cost in terms of ill health, families in crisis, children in care etc as a result of the cuts to support for low income families which are not shown on the charts.
And dont get me started on Council Tax Benefit/Support!
And yes we need more square holes for square pegs and round holes for round pegs
Thank you
And Jacqueline is not here to ask right now.
Thanks to you and your team for another x-ray article which also has the atribute of demonstrating how greedily manipulative the main stream media, not least the B.B. C. and most politicians are.
Might the personality attributes of those seeking these cuts include greed and bullying?
Might those who promote attacks on the weak seek to futher the root purpose of Neoliberalism which is the making our society “ heartless and soulless, with the majority of its people seen as units of labour, automatons, functionaries, objects for achieving designated tasks, and as costs to be minimised.” (From Tim Field)
Thank you and well said, Richard.
May be a quibble: We do have a welfare crisis of sorts. Spending on the royal family is out of control.
Agreed.
The government may pay a landlords mortgage off, but if you own your own home, and become too sick to work, they offer only an interest bearing loan to cover the mortgage interest, making an effective interest rate in excess of 10% in my case. This loan is secured on your home, and realised once you sell your home or die, making sickness a multi generational disaster. The DWP leaflet about Mortgage Interest Support, tells you to sell your home and move somewhere cheaper, ask friends to pay your mortgage or take the loan; options that were given to me whilst I was literally too sick to get out of bed, and during a period of time when I have never been more grateful for my friends and local support network. ( I couldn’t get Life/sickness insurance because of the symptoms of my undiagnosed condition, and I have friends who have had strokes who are in the same position.) The government used to pay the interest as they would housing benefit, but now they take your home, slowly, and without paying a penny towards the capital costs. Add to that the staffing crises and other issues at the DWP, which means they can take more than a year to process benefits that you are entitled to, and the fact that standard universal credit is just over 400pm, calous and cruel doesn’t cover it, the process must be intended to be a punishment and cause harm. Food banks are a life line for many, if you can get there, yet in food bank Britain where there is a 20 year difference in the healthy life expectancy between the most and the least deprived, (see kingsfund), meals in the House of Commons are still subsidised and we refuse to tax the 1%.
Thank you, and good luck.
Thinking about it a bit more…….
Do we know the percentage of GDP that goes on ‘Private’ pension provision?
I understand that many European nations do all/most of their pension provision via the public sector which may well skew the UK figures
I dont, sorry. Try AI, I suggest.
P. S. To add to the informative, possibly signpost, comment of Robin Horan, here is a comment from A I Overview.
”Luxembourg, Denmark, Norway, and Switzerland lead globally in combining high social security and welfare payouts with strong, flourishing economies.”
Two are tax havens
Radio4 did have OBR head on after the budget – and he sort of acknowledged that ‘welfare’ spending was not significantly increasing – and certainly not ‘ballooning'<p>
The interviewer Justin Webb or Nick Robinson or someone – simply ignored that – instead of pouncing on it and asking for further illumination as we had already had weeks of both Tory and some Labour saying that ‘welfare’ was out of control – and did have to come down,<p>
This is a classic example that once the propaganda ‘story’ is out there – it just has to be maintained – against the facts of the matter. So facts – and the OBR- are ignored, economists who would challenge the narrative are not interviewed or invited on panels, politicians who disagree are marginalised as extremists.<p>
We are already in 1984
Much to agree with
Cutting benefits? All for it.
Of course once needs to start with those extracting the largest amounts of cash from the gov (= go where the money is) & thus one starts with Mr Windysor & his offspring.
How many millions are hosed at him, why? and why can’t we turn him into a source of revenue, as opposed to a money pit?
Bucky-Palace? – could charge top dollar to Americans (sleep in the kings bed? certainly sir £10k for the night – yes it includes servants to squeeze your toothpaste).
Windysor? Maga supporters – sleep in Mr Trumps bed. etc. £10k / night a snip :@ twice the price.
I wonder what bad-Enoch & co would think of these very sensible suggestions ? Or the nice Mr Burnt-ham? Money generating and reducing the need to squeeze the peasants.
The figures on Housing Benefit show a big drop around 1990. If I remember correctly that was when Housing Benefit was reduced so that it no longer covered actual rent. In addition to that there have been repeated attacks on it since 2011, with benefit linked to a proportion of the local market rents, benefit assuming that there was no spare room in a rented house – couples without children had the right to only one bedroom, however many bedrooms they have, and so on. So there have been attempts to limit the support given to private landlords, except that the landlord was not required to charge only the rent that would be covered by Housing benefit but could, and still can, charge whatever they like.
Thank you