
The government's own economic forecasts reveal something extraordinary about Labour's Budget. The figures simply don't add up.
I've examined the Office for Budget Responsibility's forecasts underpinning John Healey's October 2026 Budget, and what I have found is deeply worrying.
The OBR's assumptions about oil prices, gas prices, inflation, interest rates and economic growth are, in my opinion, fundamentally unrealistic. Some appear to have been overtaken by events before the Budget was even delivered.
But the consequences go much further than inaccurate economic predictions.
The government's own figures suggest that real household incomes will barely grow, savings will fall, mortgage costs will increase, and households will be forced to borrow more while the government attempts to borrow less.
Meanwhile, the forecasts assume improvements in productivity that have repeatedly failed to materialise.
In this video, I examine the actual OBR charts and explain why I think these projections are works of fantasy.
I also explain how I use economic experience, judgement and pattern recognition to assess whether forecasts are credible.
The central question is whether Labour has any realistic plan to improve living standards, deliver economic growth or manage the risks facing the UK.
My conclusion is deeply concerning.
If the economic assumptions underpinning the Budget are wrong, what happens to the government's promises?
And, as importantly, who pays the price? But I think you know the answer to that one.
This is the audio version:
This is the transcript:
I have already spoken about John Healey's budget on this channel, and this is another video on the same theme, but it's different because in this video I want to do two things, and I'll flag them up in advance.
The first is I want to look at the Office for Budget Responsibility forecast that supports this budget because they reveal the thinking that underpins it and how hollow the projections are.
And secondly, I want to explain the process I use when I do look at things like this, and that is the exercise of judgement that I undertake when I'm looking at forecasts to work out whether they are credible or not. And I think that in itself is also important to explain because a lot of what I do is based upon pattern recognition, in effect, and that's what I'm doing when I look at the forecasts that have been issued by the Office for Budget Responsibility. What I ask myself is, do these patterns make sense? And if they don't, I say so. And if they do, I would also confirm that fact.
And to do this exercise, I've taken a lot of the charts out of chapter two, of the three chapters that is, inside the Office for Budget Responsibility's forecasts. So these are the core charts that show the economic assumptions that underpin what the OBR is saying and which suggest why John Healey can claim he's going to meet his so-called fiscal rules and therefore the world is going to be all right according to him and Andy Burnham.
The first chart on the screen is a forecast for energy prices.
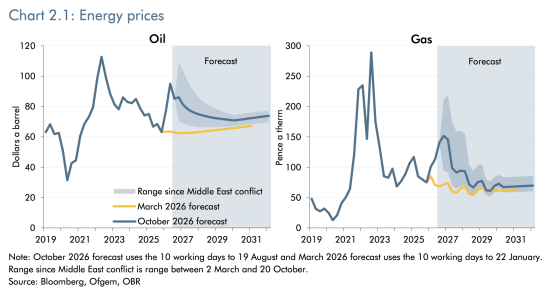
And right now, given how important energy prices are in determining inflation in the UK and, in turn, determining interest rates in the UK and the cost of living in the UK and so much else in the UK, these forecasts matter. So let's have a look at them.
Oil is on the left, gas is on the right.
And the oil forecast is that we will fall from a peak, supposedly, of oil prices of a little under $100 a barrel now to a steady rate of around $80 a barrel for the years to come. Well, this is total nonsense. The oil price today is around $115 a barrel, and everybody thinks it's going to rise. How much by? There is discussion of it increasing to $200 a barrel, and this forecast of the oil price, therefore heading towards $80 a barrel, looks like pure fiction. It isn't even true now.
This forecast was set on the 19th of August, apparently, and has not been revised since, even though the budget was presented on the 28th of October. And it's complete nonsense because the price has risen since then because stress in the Strait of Hormuz has increased because of the actions of Israel and the USA, and there is a promise that they will increase again. As a consequence, this forecast is hopelessly wrong, and therefore all the inflation forecasts, all the cost of living forecasts and everything else in this budget projection are completely wrong.
And that's true with regard to gas as well. Look at the price there. The difference between history and forecast is the white area is history, and the grey area is forecast. And that's true for all the charts we're going to be going through. And again, in all of these charts, the current projection is the dark blue line, and if there's a yellow line, it was the projection in March, 2026. But the forecast at present used in this projection is that gas will cost around 150 pence per therm at this moment. The price will rise a little and will then drop to a little more than around 75 pence per therm.
What is the price today? 245 pence per therm. The projection has already been blown completely apart. The price is still increasing. It will go much higher. Again, everything about this forecast is fiction, and that was not even acknowledged by John Healey at the dispatch box. The nonsense that he was talking about was all based upon this projection and everything else.
Let's look at the next chart. This is of interest rates.
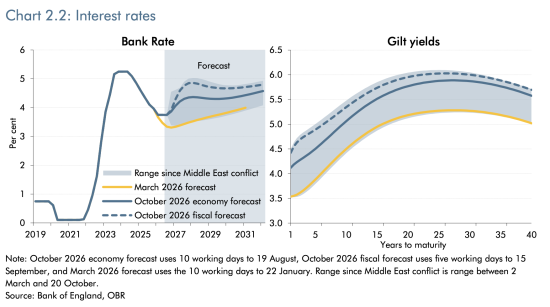
This presumes that interest rates in the UK will rise from where they are now, at 3.75%, and the base rate might reach 5% before settling a little below that over the coming years. The assumption implicit in that is that we are going to see rates which are going to be uncomfortable with regard to the cost of living. And the implied consequence is that inflation will be under control, but not so much under control that rates can begin to fall. That is clear from the forecast.
So even the oil and gas prices just noted are sufficient for the Office for Budget Responsibility to think that the Bank of England is going to raise rates and keep them high, and that is their projection. The same is true with regard to gilt rates. Those are expected to rise, and they are expected to stay high.
Now what does that mean? If we get an increase in oil and gas prices, these projections are blown apart. The Bank of England, if it's going to try to meet its 2% inflation target, it's going to push rates much higher than this. And therefore, yet again, the cost of living projections, which are based upon the bank rate in the sense that it impacts rent and the cost of mortgages, are total nonsense in this budget. Everything it says is wrong, and so is the government's cost of borrowing as a consequence, because if the Bank of England is going to push up base rates, and I think that likely, and I think this projection is wrong, borrowing costs will be much bigger than this projection suggests.
So let's move on to the next key forecast, and that is for inflation.
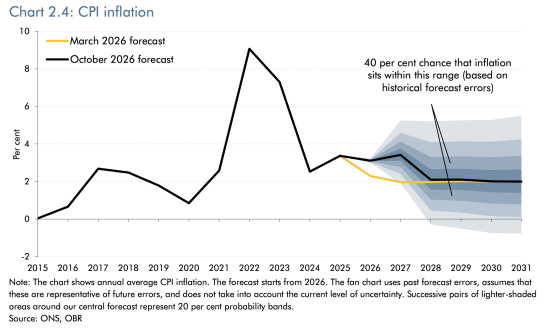
And guess what the Office for Budget Responsibility says, and you can see the black line here, which is the current forecast, that inflation will be on target by 2028, and they always say that.
All of these forecasts are built on the basis of the assumption that everything returns to normal, where normal is the key parameter that is being used to determine the forecasts. Now, this government runs itself on the basis of projecting inflation, as does the Bank of England under its instruction. And so the forecast is that inflation will be 2%.
The question is: how does the country get to 2%? That is the basis of the whole projection. All of this projection is about doing two things. One, getting inflation to 2%, and two, making sure that John Healey can supposedly meet his fiscal rule, that he will not have to borrow in excess of forecast ratios to GDP, set out for no good reason by Rachel Reeves some time ago.
Well, when it comes to inflation, the forecast is that he will achieve his goal. Will he? If the price of gas, the price of oil, the inflation rate, and the borrowing rate all go up. No, of course you won't. All of this is nonsense, but it is what the Office for Budget Responsibility have to say.
What is the consequence of that? And this is really interesting. This chart is of nominal and real earnings growth.
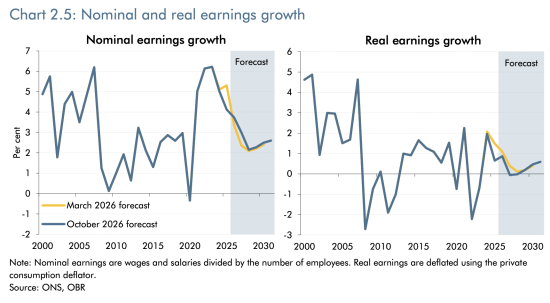
This is what you will feel will be happening with regard to your earnings. And look at that blue line on the left. That's the amount you are actually going to be paid. You are not going to have real pay rises. Those are going to fall in real terms. Presently, they're running at just around 4%. But that's going to decline. It's going to be a little over 2% according to this by 2027. And it might rise a little bit by 2030.
But in real terms, that's the right-hand chart; look at that forecast. The forecast is that you are going to see almost no real growth in your earnings over the coming five years or so. This is the baseline projection that a Labour government is presenting as if it is a measure of success. They are forecasting that people in this country will get no better off, and yet they're trumpeting that this is what they're creating. This is the supposed breathing space they're providing. It's total nonsense.
And when we look at real household disposable income, and this is per person, we look at the right-hand chart here.
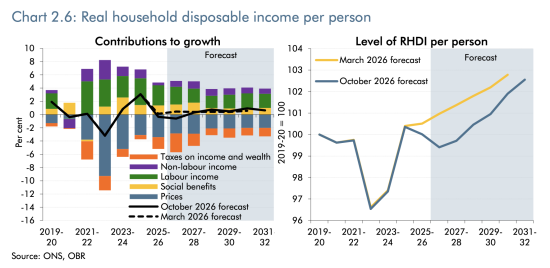
The left-hand one is too complicated to discuss, but it only feeds into the right-hand one. You'll see that the forecast - and here the bottom blue line is the relevant one - is that actual real household disposable income per person is going to decline from now until 2029. And if you watched our video on the Asda forecast of the cost of living, you will understand that 40% of people in the UK do not already have enough to meet their basic needs in this country. And the forecast in this budget is that that will get worse, with a little bit of an uptick, and only a little bit of an uptick, in 2030/31.
This is what Labour is saying. They're planning to go into the next election having reduced your living standards. And I think this chart, the chart of the rolling 10-year average growth in real household disposable income, is incredibly telling.

This chart runs from 1965, when I was a 7-year-old, to date. And the white part is reality, and the grey part is what is being forecast.
Your hopes of an increase in your standard of living have been blown apart by the Office for Budget Responsibility in this budget. Their forecast is that you are going to see no growth at all. Just be clear, the forecast is all under 0.5% a year. You will not notice a change in your income of 0.5% a year in real terms, because that's less than £1 in £200 to put it in context. This suggests that against the history of our well-being over the last 60 years, Labour is going to deliver nothing for you and has no chance of improving your well-being before the next election.
No wonder Andy Burnham looks like such a worried man. He's taken on the job of governing this country, and he hasn't got a clue what to do, and everything is going down the pan, including your hopes of improving your well-being. There is no chance for this country inside this budget as a result. The claim that this was a budget for working people is utter nonsense.
And the same is true with regard to growth. This is the potential output growth.
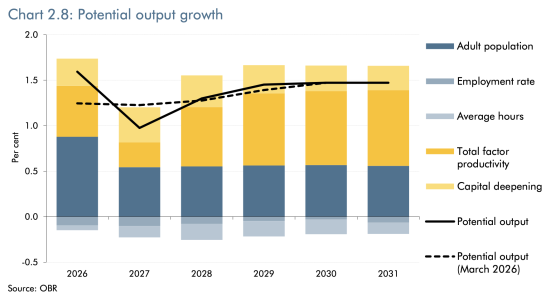
And this looks at where growth might come from in the UK economy. And it's quite interesting because if you actually look at the below-the-line figures, those are the sort of pale blue numbers. The employment rate and the number of average hours worked are going to decline according to this forecast over the next five years. There is going to be an increase in growth, though, and where's it going to come from? A growth in the adult population. Where does a growth in the adult population come from, given that so many people now have grey hair and are retiring? That can only come from migration, of course. And where's the other part of growth coming from? Total factor productivity. In other words, we're going to be sweated harder to work more to deliver output.
And the key assumption here, and let's be honest about this, is that output growth is going to happen because of AI and continuing inward migration.
And this, by the way, is the chart of migration.
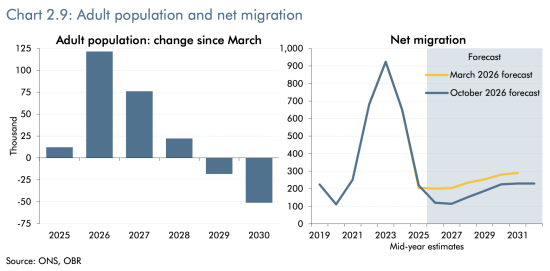
Have a look at the right-hand side one. That is more important than the left-hand side one here. The forecast is that migration is lowering. It is now under 200,000 people a year. Remember, a lot of people arrive quite legitimately into the UK, and this is also a net figure, i.e., it's the difference between those leaving and those arriving. There are going to be net arrivals. That number is going to decline, but will then steadily rise from 2027, again, more than doubling from a rate of around a hundred thousand a year to nearly 200,000 a year. And that is the only basis on which John Healey has been able to forecast growth in the UK economy. Nothing else delivers it, as the previous chart showed.
Will we increase output per hour? I find this chart quite amusing here.
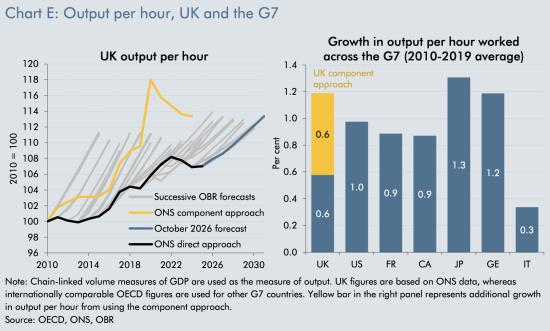
Here I'm interested in the left-hand chart, and the bottom line is the interesting one. We are looking at a figure where there's a pivot. You can suddenly see that bottom blue line begins to shoot upwards. That is 2025. We've seen a slow and steady growth from 2010 to 2025, with a downturn at the time of COVID, of course, and now suddenly that figure's going to go up. But that has been forecast in every single Office for Budget Responsibility projection since 2010. Just look at their figures. Those pale grey lines show that they forecast this every year, every time they've issued a forecast. And let's look at the reality: the forecasts have not happened.
So, the underpinning assumption of growth, which was migration plus improved productivity, is never delivered. They are just fantasists. We are not going to see the growth that is forecast in this budget projection. Everything that John Healey says about balancing his books is, as a consequence, a load of nonsense.
But at the same time, this chart is important. This is the output gap.
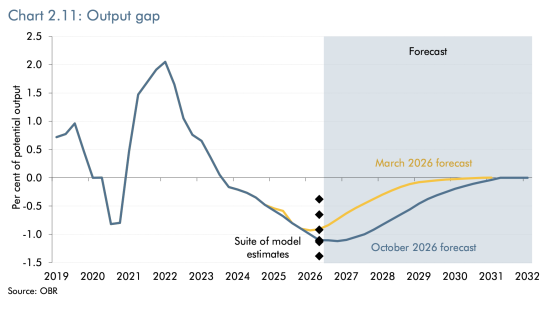
Now remember what modern monetary theory says. MMT says that we can spend into our economy so long as there are resources to be put to use. And what this chart shows is that there are resources to be put to use. We have a shortage of use of capacity in the UK at present. Since 2023, we have actually been running an economy which is well below par with regard to potential output.
Now, it is assumed by this projection that this will reverse and the output gap will be removed by 2032, although there is no explanation as to why the trend, which has been persistent since the end of the COVID era, will change. We have seen continuously falling output and an increase in the output gap since then, and that apparently is all going to change next year, and we're going to see growth.
Do you believe that? No. Do I believe that? No. Why? I can't see any reason why this will change.
But MMT would change this because MMT asked the question: have we got resources to put to use? And, of course, we have in the UK. We have unemployed people, in particular. They could be employed. We could put them to work. If there were jobs for them to do, people would want to do them. They would get fair pay, I would hope. But that would resolve this problem.
The point is MMT is providing an accurate projection tool here. The government has no idea how it's going to reverse the output gap. We are seeing nonsense once again.
And as a result of all of this nonsense, the government is forecasting that real GDP growth will be around 2%, but that's in the same area of fantasy as the projections for inflation.
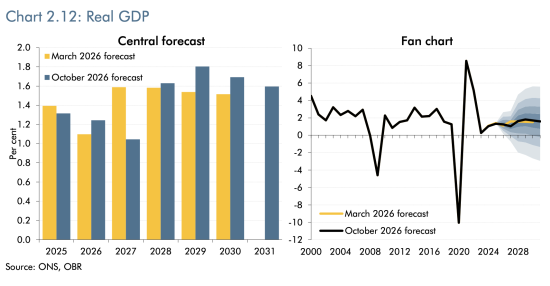
In fact, the forecast is actually slightly worse this time than it was in March, 2026. But let's be honest, take all of this with a pinch of salt. And you see that fan at the right-hand side of the right-hand chart: that shows the margin for error. Even the Office for Budget Responsibility realise there's a lot of nonsense in here.
Let's look at unemployment then, because I have already begun to mention it.
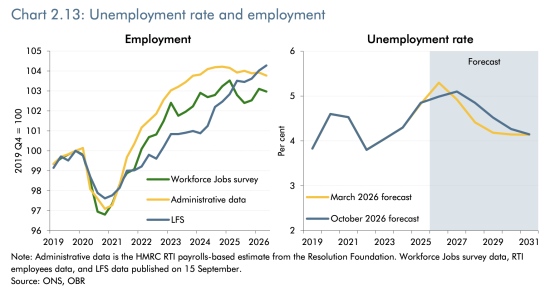
This is the chart of both employment relative to a fixed starting point of 2019, which is the left-hand side chart, which shows that real rates of employment in the UK economy have risen since then. Why have they risen? Largely because there are more people in the UK. That's partly because of migration, of course. That's the real reason why employment has risen.
But let's look at the right-hand chart, which is of unemployment. And remember that when we put up interest rates in the UK, or rather when the Bank of England puts up interest rates in the UK, it has one objective, and that is to increase unemployment, and they have succeeded. They started putting up interest rates in 2021 and look, the unemployment rate has risen. It's now approaching 5%. The forecast is that it will reach 5% in a year or so's time, and that is because they're forecasting an increase in the Bank of England base rate. But then apparently it will decline, but the base rate won't.
So this forecast of declining unemployment when there is actually a forecast of a steady and stable bank base rate above the current level is just total nonsense. That's rubbish.
This is where my instincts come into play. This is where I'm looking for the patterns. I see a forecast for the bank base rate. I see a forecast for unemployment. I know the two are related, but there is no correlation. This has to be wrong.
And remember, the bank base rate is going to go higher if the Bank of England follows all normal precedents and we get more inflation as a consequence of oil price increases. And so this unemployment rate is in fact going to remain high and not fall as the government forecasts. Yet again, we have total and utter nonsense.
This chart: household savings rate; now I find this one particularly interesting.
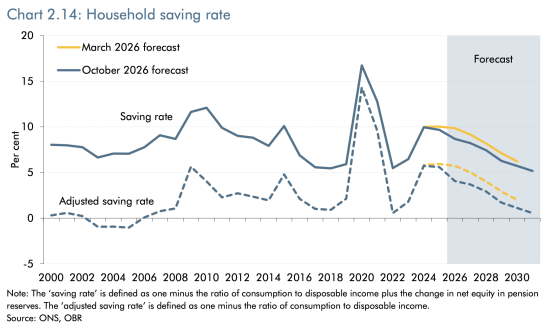
The government is forecasting something really quite unusual here. Don't worry about this adjusted savings rate. Just look at the top line, the savings rate. That is the one that really matters, but the patterns are broadly similar, as you can see. And look at the blue lines and ignore the yellow lines because they are all projections.
The saving rate is the rate at which households have money to put aside to save for a rainy day. That is what it is. Saving for the rainy day. Saving for the pension. Saving for whatever they want. But the fact is that throughout the remaining life of this parliament and beyond it, the government is now forecasting that households are going to cut their savings rate.
Now, why do people cut their savings rate? Either because they feel incredibly confident and feel they don't need to save because good times are here to stay, and there's nothing in this forecast which says that's going to be the case. And consumer confidence is incredibly low in the UK. Or people cut the savings rate to compensate for the fact they haven't got enough income to get by. That is what this chart is saying.
This chart is saying that the savings rate in the UK, by households, is going to decline and decline significantly from around 10% of your total income. Now, not every household does that, of course, but some do, to around 5%. Again, not every household can even afford to save anything, but some do. But the savings rate is going to virtually halve in the UK according to this forecast. Everyone is going to feel the pinch, in other words, and they are going to cut into their savings to maintain their lifestyles, reducing those savings as a consequence.
This is quite an extraordinary projection. It is a projection that says that well-being is going to decline in the UK. That's how I read this forecast. It's incredibly worrying.
And at the same time, the government is hardly optimistic with regard to corporate profits.
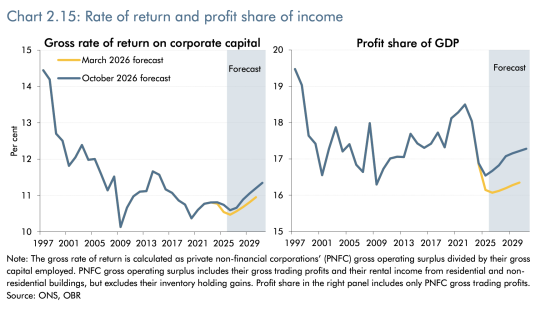
Just have a look at the right-hand chart: profit share as a share of GDP; conventionally running at around 18%, or thereabouts, but now running at something below 17%. The government thinks it will rise a bit, but not by much.
What's the relevance of this? The relevance of this is that the government does not see a boom in the corporate sector as well. And that means they are not projecting an increase in household well-being. They're not increasing corporate well-being, and they're not planning to spend any more themselves. So where is well-being and growth going to come from? There is nothing in this forecast to suggest what is going to happen and why it's going to happen.
The sectoral balances are something that is important to me.
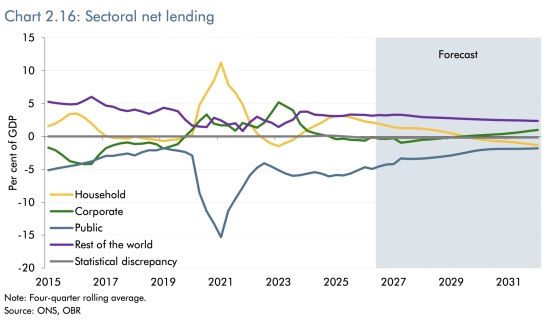
This, to me, is the most important chart in any budget. We have made a video on the sectoral balances, which will be out this weekend as part of the Understanding Economics series. But this is the current sectoral net lending forecast for the UK included in this budget.
And the importance of the sectoral balances, which I will explain again in the Understanding Economics video, is that it shows how money works within the sterling economy. This is the sterling economy in total. This reflects all the sterling in use inside our economy, and it ignores all other currencies. And that's fine because almost all transactions in the UK are in sterling.
And look at the pattern. Every single entry, which is above the line, must be matched in totality by an entry below the line. That is the way in which the sectoral balances work. And the sectoral balances work around four sectors of the economy: one is households, one is corporations or companies, one is the public sector, and one is the rest of the world.
Now, the rest of the world always saves in the UK. We buy more than we sell to the rest of the world, and, rather kindly, they leave their money here. So the top purple line is the rest of the world. It's a fixture. It's always positive. So long as we do not change our net balance of trade, that line is going to continue, and it is in this chart. It is assumed that we will continue to import more than we export.
The yellow line is households, and look; here, the forecast is that households who are currently saving are, as I've already explained, going to move downwards. They're going to become net borrowers, in fact, according to this projection. That is where households are going. Households at present are cumulatively in total saving, and instead they're going to cumulatively in total become borrowers because they will not be able to make ends meet.
But rather, perversely, companies, which are at present very slightly net borrowers, that's the green line, will become net savers. They're not going to invest. They're not going to fuel growth. And at the same time, the government claims, because all these numbers have to balance, that it is going to borrow less. The whole chart is, by the way, designed to try to achieve that blue bottom line: the forecast that the government will balance its books and the fiscal rules will be met, and it won't happen because every single forecast that the OBR has ever produced of this type has always forecast that government borrowing will fall. And it never does, as you can see from the patterns on the left-hand side, the white area of this chart.
But they're claiming that the government will borrow less because households who will be worse off will be forced to borrow more. The government is shifting its debt onto us, in other words.
What a policy. What a plan from Labour. We are going to be made worse off [the video says better - my apologies] so it can balance its books. And this is an absolute fact. This is a description of reality. For every borrower in the UK economy, there has to be a lender. And so those sums must add up to zero as a matter of fact. And the truth is here that the government is planning to dump its debt onto households and make everyone worse off as a consequence.
And that is seen in charts like this: The costs of mortgages.
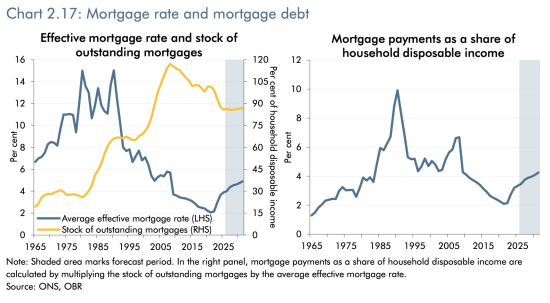
The value of mortgages is going to rise. The cost of mortgage payments is also going to rise. Look at that right-hand chart. That's the particularly important one. Look at the grey area, and you will see that there's a steady upward line in the cost of mortgage borrowing. And if you think your situation with regard to your mortgage payment is bad now, just watch that chart go upwards.
And remember, this is based upon a projection of the bank base rate, which is itself wrong because oil and gas prices are going to rise, and so the chart will, in fact, when history comes to be told, be much steeper still. And there will be a much higher cost of mortgages before we reach 2031 unless we've had a crash and something has changed in the meantime, which I suspect it will.
Look at this chart as well. I think this one is quite amusing.
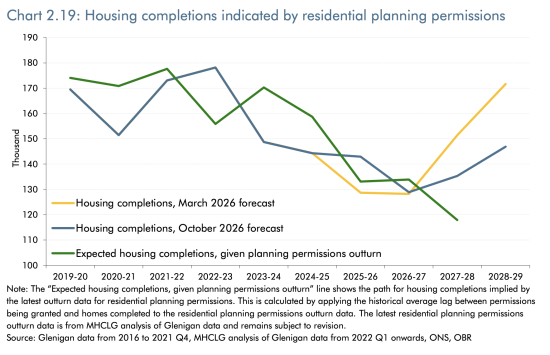
It's the last chart of those I'm looking at, but it does tell you how absurd some of these projections are. This is the projection of housing completions, which does, of course, have an impact upon house prices. The projection was in March, the yellow line, that Labour was going to achieve more than 170,000 houses built a year. Now that has been downgraded. The figure now is around 145,000 or so houses to be completed each year. But look at the green line. That's what is actually likely to happen as a consequence of approved planning permissions, and that's heading sharply downwards. Like the rest of this whole projection, this is a fantasy.
The idea that we're going to get lots more houses completed when there aren't planning permissions available to ensure that is the case is quite obviously absurd. We are not going to get that outcome. It is not going to happen. There is no reason to think it is.
And let's stand back from all these projections now, and let's just offer you a summary.
These projections are works of fantasy. Now, I prepared lots of projections in my time for businesses. I built lots of business simulation models. I presented them to clients and always said, “This forecast is wrong,” and it's true. Every single forecast is wrong. They're all based upon assumptions. But they can be based upon plausible assumptions, or they can be based upon implausible assumptions. And over many decades of doing these things, I have obtained the instinct, the judgement, if you like, based upon experience to be able to tell the difference between the two.
This forecast is based upon utterly implausible assumptions as to energy cost, and as to likely interest rate costs if we get the inflation that those energy costs will fuel, and the Bank of England behaves in its normal way.
And even then nothing in here takes into account the risk of an AI bubble burst, the risk of that war getting worse, or that we have supply chain issues caused by climate change.
So, this whole projection is ludicrous. My instincts tell me everything is wrong here. Nothing adds up. These projections do not make sense. John Healey is not going to balance his books. He's not going to meet his fiscal rule. There is no fiscal headroom, a term which, in itself, is a crazy thing to claim that he has, because fiscal headroom is the comparison between the forecast and an assumption. And as a result, there is no sound basis in this budget for the management of the UK economy by our Treasury, and that is profoundly worrying.
We need to be deeply concerned about the direction of our economy at the present point of time. But if anything, we need to be more concerned about the fact that our Treasury is so out of control that it can produce documents like this.
That's what I think. What do you think? There is, of course, a poll down below. Please do like and share this video. Please do subscribe to the channel. Please hit the bell button because then YouTube will tell you when we make new videos. And if you'd like to support work that produces an analysis like this, then please do make a donation to the channel. There is a link below to our Ko-fi page where you can do that.
Poll
Thanks for reading this post.
You can share this post on social media of your choice by clicking these icons:
There are links to this blog's glossary in the above post that explain technical terms used in it. Follow them for more explanations.
You can subscribe to this blog's daily email here.
And if you would like to support this blog you can, here:

 Buy me a coffee!


As with all statistic results published they can be openly manipulated to show almost anything.
The OBR, who independently work for the government have done such so with their guess work statistics, how can any one predict the future, no one believes it just Dumb politicians.
As your work has shown Richard, the OBR are living in a fantasy world which no one believes, except the LAB gov, who are all left wing Commies any way at heart.
How the hell do they think they are going to win any election in the next three years with this sort of budget, business do not vote politicians in it is the nations citizens who do.
[…] rarely record a single-take 28-minute video, but I did yesterday as I talked through the charts in the Office for Budget Responsibility's report that underpins John Healey's […]
This is a really superb critique, Richard, thank you. Very comprehensive and digestible.
Just to check – in the 8th paragraphafter the sectoral balances chart you state this:
“What a policy. What a plan from Labour. We are going to be made better off so it can balance its books. And this is an absolute fact. This is a description of reality. ”
Is the emphasis not that we are to be made worse off? The punch line is so good otherwise because it summarises the whole budget.
thanks again.
It should be worse off. An error in 28 minutes? Sorry.
“The only purpose of economic forecasting is to make astrology look respectable.” JK Galbraith
Not quite, but fair.