Myth
The UK national debt is heading for 100% of GDP, which measures our total national income.
Reply
This is simply not true. The government chooses to use a measure of national debt that ignores the fact that more than 30% of the UK's national debt is now owned by the government itself. That is the result of what is called quantitative easing (QE), which is a technical term for the Bank of England buying back debt issued by the UK Treasury on the Treasury's own instruction, which the government can give because it owns the Bank of England.
And, as the Bank of England has now acknowledged, the chance that any of the debt that it has bought back from the financial markets will ever be resold back into those same financial markets is remote, in the extreme. None ever has been. In that case, for all practical purposes this debt has been cancelled. UK national debt should, then, be stated net of all quantitative easing because that debt does, in effect, no longer exist.
And, if evidence is needed, the government's own accounts reveal that this is how they account for their own debt owing.
In that case the claim that the UK's national debt is going to exceed 100% of GDP is simply wrong when it is expected that much of the UK government debt to be issued as a result of the coronavirus crisis is going to be bought by the Bank of England.
The evidence
The UK national debt has increased as follows since 1974, with the figures being stated in original prices, and with the data being stated gross i.e. before quantitative easing is taken into account, and net of QE, with the amount of QE issues also being noted by year, with that sum being allocated to the year in which the purchase was authorised:
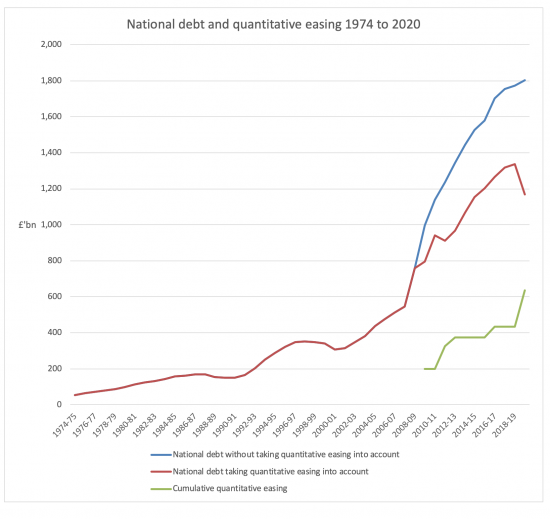
By March 2020 £635 billion of quantitative easing had been authorised by the UK Treasury and the Bank of England. As such the national debt was not £1,800 billion at that time, but was actually a third less, at just under £1,200 billion.
As a percentage of GDP this had the following effect:
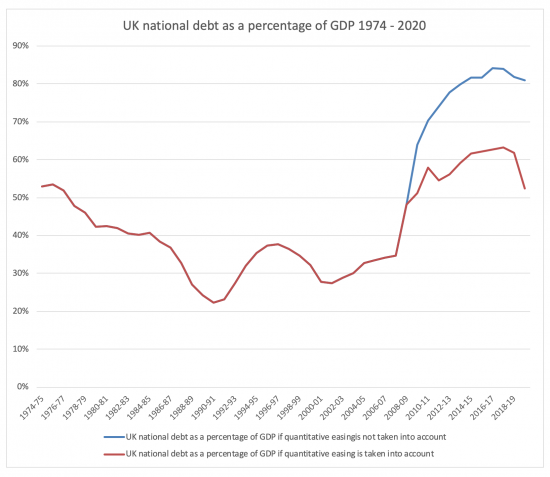
As a consequence, UK national debt as the coronavirus crisis started was at historically low levels.
And per head of population, at current prices to ensure compatibility, the figures are as follows:
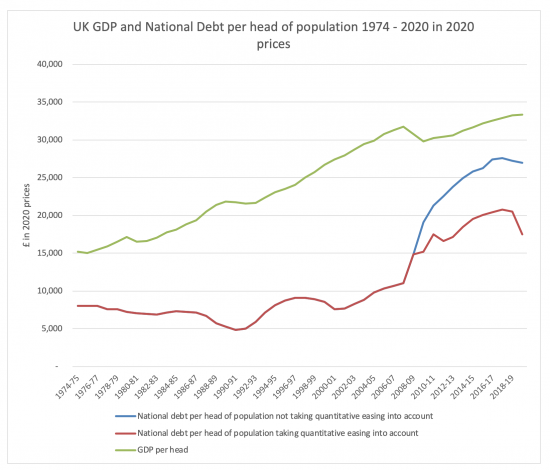
GDP per head has more than doubled since 1975 in real terms, albeit that by no means everyone will feel that.
Notionally national debt appears to have grown, but after quantitative easing it has not by 2020 in proportion to GDP. This might stay true throughout the coronavirus crisis if most government debt issued during this period is bought by the government, as many think might well be the case.
In that case it is simply not true that UK national debt is now heading to be 100% of GDP.
This fact is confirmed by what are called the UK government Whole of Government Accounts. The most recently available are (rather surprisingly) those are for the year to 31 March 2018. Note 20 to those account is as follows:
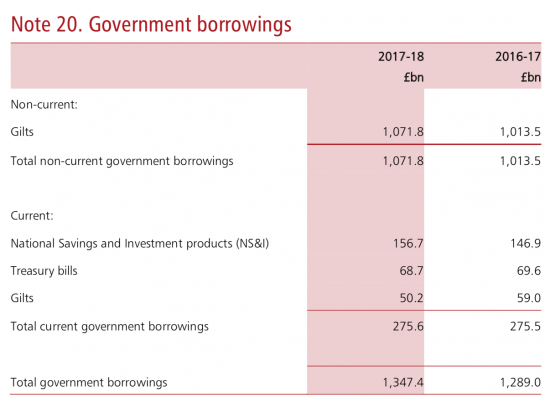
According to this note total UK government borrowing in March 2018 was £1,347 billion, and a year earlier was £1,289 billion.
The equivalent figures in the data used to prepare the charts noted above, based upon information from the Office for Budget Responsibility, were £1,317 billion and £1,266 billion.
The discrepancies are annoying, and almost certainly because the system of accounting used for the Whole of Government Accounting system differs slightly from that used by the Office for Budget Responsibility, but what is clear is that the two are similar, and both are net of quantitative easing. The Whole of Government Accounts make that clear.
The government does then recognise that its own borrowings do not include quantitative easing debt in its own accounts and as such it should not claim it owes sums that are not due in its statements on the national debt, and yet it persists in doing so, meaning that all such announcements are wrong.
Notes re data sources: Most of the data used is based on that available from the Office for Budget Responsibility. Quantitative easing data comes from the Bank of England. Population data is from the Office for National Statistics.
There are more Mythbusters here
Thanks for reading this post.
You can share this post on social media of your choice by clicking these icons:
There are links to this blog's glossary in the above post that explain technical terms used in it. Follow them for more explanations.
You can subscribe to this blog's daily email here.
And if you would like to support this blog you can, here:

 Buy me a coffee!

Under the first graph: “As such the national debt was not £1.8 billion at that time, but was actually a third less, at just under £1.2 billion.” – I think you mean trillion in each case, i.e. £1,800 billion and £1,200 billion.
Indeed
Those should be trillion…
Thanks, really informative.
The Bank of England was made independent of the UK government in 1997 and the decisions over Asset Purchasing (the BoE does not refer to it as quantitative easing) are taken by the monetary policy committee (a group of independent economists tasked by the bank with settings their monetary policy) and so is not “owned by the government” in any way. The debt still exists.
Oh dear, you’ve fallen for a con-trick. I may write the reasons up as a mythbuster today
The BoE (since 1946) is owned by the Treasury Solicitor (ie. the government). It was made “operationally independent” in 1997 but the government still owns it and has complete power to set the Bank’s objectives. All 1997 did was end the Chancellor’s direct involvement in day to day interest rate policy.
And even then very notionally….a mythbuster is coming
They were planning to produce the WGA for 2018-19 in 12 months, i.e. by the end of March –
“The usefulness of the WGA remains limited by the time it takes to produce. We
support the Treasury’s ambition to publish the WGA within nine months of the
end of the financial year. However, we remain concerned that the time it takes to
produce the WGA means that government is not making the most of this valuable
resource as a decision-making tool. The Treasury published the WGA 2016—17
in June 2018–just 15 days faster than the previous year. The Treasury expects to
publish the WGA 2017—18 in May 2019 (14 months after the end of the financial
year) and says that work is currently a month ahead of schedule. The Treasury is
working to reduce the amount of time it takes to produce the WGA. It plans to
publish WGA 2018—19 by the end of March 2020 (12 months after the end of the
financial year), and WGA 2019—20 by January 2021 (around 9 months after the end
of the financial year).”
https://publications.parliament.uk/pa/cm201719/cmselect/cmpubacc/464/464.pdf
I guess the pandemic will be the excuse, so failing to meet 14 months (which was “achieved” for WGA 2017-18) was inevitable. Meanwhile, the Scottish Government consolidated accounts for 2018-2019, and the audit report on them, were published in September 2019.
I think this delay inexcusable …..
I have a slightly uneasy feel about you busting this myth – which you do. I fear that busting it gives credibility to those that believe the level of debt is crucially important.
I see the point ….. I will add a balancing one….
What you are saying isn’t true, unfortunately. You haven’t even been honest with the data you provide.
The ONS data you link to shows that net public sector debt is £1804bn for 2019/20.
It is also untrue that QE owned debt at the BoE is cost free – at the moment that debt costs MORE than debt not owned by the BoE.
Saying that QE will never be unwound is firstly also untrue, but more importantly ignores that fact that the BoE can lose money on the debt they own if interest rates move higher, so unless you expect rates to be at 0.1% for ever there is still a massive cost waiting there.
You are trying to give credence to the story that government can borrow as much as it likes, ad infinitum, without ever worrying about having to repay and regardless of cost. This is of course nonsense, dishonest and academically ignorant.
Let’s deal with this
I have used the data properly
The QE data is debt free
You cannot say that the payment of interest on central bank reserves is a cost of QE – they are not the same issue – so the claim is false
And the BoE is indemnified for losses on QE
In other words, you are wrong.
And you really do need to learn about money – because you are making ridiculous claims about what I have said that are wholly incorrect as well
Yes, let’s deal with this.
“I have used the data properly”
No, you haven’t. ONS clearly states net total debt is the full £1.8bn.
“The QE data is debt free”
Data is debt free?
“You cannot say that the payment of interest on central bank reserves is a cost of QE — they are not the same issue — so the claim is false”
The BoE themselves say the payment of interest on reserves is a major issue, especially when rates on long bonds are essentially equivalent to the base rate. They are not exactly the same issue, but the issue at hand is that you are claiming QE is cost free – when the BoE clearly state it is not. One mechanism of which being the payment of interest on reserves – QE increasing the amount of those reserves.
“And the BoE is indemnified for losses on QE”
So here you explicitly agree that QE can cost, when bonds owned by the BoE lose value through higher rates.
Of course, it is the government who indemnifies the BoE, so at the end of the day any losses are paid for by the government. QED. QE is not cost free.
“In other words, you are wrong.”
Looks to me like you are actually agreeing with what I have said – QE has a cost – because you agree that interest is paid on reserves and the BoE can lose money on QE bonds. SO what part of my argument is wrong?
Whereas your argument basically amounts to “QE costs nothing” (wrong), “QE cancels debt” (wrong) and by implication “governments can borrow as much as they like thanks to QE” (wrong).
You aren’t even honest about what the BoE says – you claim “And, as the Bank of England has now acknowledged, the chance that any of the debt that it has bought back from the financial markets will ever be resold back into those same financial markets is remote, in the extreme” yet nowhere int the link you yourself provide do the BoE say anything of the sort.
What you are saying is mostly incorrect, and a lot of it is outright dishonest. One would have thought an academic would have a bit more integrity.
I disagree with everything you said
I wrote in haste on one point, I admit and should have said the QE debt is interest free. As a matter of fact it is
The ONS have the debt wrong – as I proved with the accounts
And your claim that central reserves can be equated with QE is simply wrong – more central reserves would have been required come what may post 2008
And as for underwriting – all that shows is that the BoE is not independent
Politely, stop making a fool of yourself, I suggest
And I have the link to where an MPC member said what I claimed
I not only have integrity, I’m right
You can disagree all you want, but it doesn’t make what you are saying any more true.
“I admit and should have said the QE debt is interest free. As a matter of fact it is”
No, QE debt is not interest free. The BoE recieves the interest on bonds it owns, but that amount doesn’t get passed back to government on a 1:1 basis because of the various costs of QE.
“The ONS have the debt wrong — as I proved with the accounts”
The ONS state the gross and net national debt. What are the chances they have got it wrong?
Or is it more likely that you have got it wrong? I’ll give you a clue.
You claim that the UK government whole accounts show total government borrowings at £1347.4bn. True thus far. You hen claim this means the debt has been “cancelled” at which point you make a huge mistake, showing your lack of understanding. So where has that other£425bn gone?
If you understood the whole govt accounts or just bothered to read on a bit, you would see that in the section “Other Financial Liabilities” the deposit by banks line is 555.8bn. Which is where he £425bn of QE is sitting. It is purely the way the government presents their accounts. No debt cancelled by QE – as the liabilities side tells you if you are capable of basic accounting. Go back to the days before QE and that number was about £18bn.
So simply put, you are 100% wrong on this one.
“And your claim that central reserves can be equated with QE is simply wrong — more central reserves would have been required come what may post 2008”
You are trying to sidestep the question, answering something I didn’t ask. It is quite possible more central bank reserves would have been necessary, but this is beside the point. QE DIRECTLY creates more central bank reserves, and the BoE pays interest on those reserves. The two are DIRECTLY linked and just looking at the data you can see that QE has created at least the same amount of reserves. So it is reasonable to say that given QE leads to creating reserves in an equal amount, and reserves cost money, QE has a direct cost, and is therefore not cost free.
“And as for underwriting — all that shows is that the BoE is not independent”
Apart from not understanding what underwriting means (you be underwritten AND independent), once again you are trying to avoid the question. If the BoE loses money on the bonds it holds in QE, someone still has to pay for it – whic in this case means government. So once again, QE can cost money.
“Politely, stop making a fool of yourself, I suggest”
You are the one making exaggerated and incorrect claims here. Suggest you take a look in the mirror.
“And I have the link to where an MPC member said what I claimed”
This is simply untrue. the link you provided, to a post by Gertjan Vlieghe says nothing of the sort. He actually states
“We carried out several rounds of QE operations after the financial crisis, expecting them
to be unwound some years later as the economy improved sufficiently. But the economy did not improve
sufficiently, the neutral rate of interest fell more persistently than we expected, with the result that the amount
of gilts we own has so far not been reduced”
Not your claim that the QE bonds will never be resold to market. Once again, you are making dishonest claims.
“I not only have integrity, I’m right”
Judging by the various statements you have made which are simply not true – not least putting words into the mouths of central bankers, it looks like you don’t have much integrity. You certainly aren’t right – as I have pointed out at length here. Your claims are so obviously bogus that you would have to be delusional to continue believing them.
I will make just one point because yet again you are writing nonsense
You claim interest is paid in QE debt and not returned in full
That is pure nonsense: Osborne ended that to make clear just how long ago it happened
And well done for spotting that there Is more money in the system. That’s what QE does, if you aren’t aware of it
So, with respect, stop wasting my time and my readers time, because you cannot even get basic facts, let alone interpretations right
Robert,
I wouldn’t bother trying to argue with “Professor” Murphy. He won’t answer any of the points you have made, lie, then just start shouting abuse at you like the little child he is. He’ll just keep saying he’s right – because he is so amazingly experienced in the world of accounting and economics (despite not having any economics experience, being nothing more than a blogger in reality) that the stuff he creates in his shed in Ely, between playing with his model trains, surpasses the knowledge of thousands of experienced professionals the world over.
One well know professional described him as the Walter Mitty of the accounting and economics world. I quote.
“He makes huge claims with no evidence and no real understanding, and his “work” amounts to little more than re-using other people’s ideas, mixed with a little waffle. The limit of his mathematical and statistical knowledge is multiplication. He’s just another hard lefty with some sort of narcissistic complex and an ego fragile as eggshells, who wonders why the world hasn’t woken up to his brilliance. In the meantime he spends his days blogging to a captive audience and trying to jam his money funnel into every place that might provide funding for his “work”. You should ask about the amount he wanted to charge people to produce a new version of his Tax gap – which amounts to little more than multiplying three numbers together. The man is an industry joke to everyone but himself and the handful of people he hasn’t already pissed of.
Interesting
I published because it’s so amusing
Your problem is I am a full blown professor, now at three universities
I am peer reviewed published, and award winning for doing so
Serious economists take me seriously as a colleague
I created country by country reporting – the OECD recognised that last month
I co- wrote the GND
I have created new understanding on tax gaps and Rac spillovers
And created the Fair Tax Mark
No wonder you pay me so much attention….I guess I am pretty worrying.
The BoE buys gilts using money it creates. It receives the coupons from those gilts as income, it pays no interest on the money it creates.
Interest paid on reserves is a separate matter. The BoE chooses to pay interest on reserves as a monetary policy decision in order to keep some control over market rates. It should not be seen as a cost of QE.
Ask any Gilt or Repo trader and they will confirm this to be true.
Whilst governments can theoretically borrow without limit and engage in QE without limit, nobody is suggesting that this is without consequence. If the created money is not drained from an economy that is resource constrained there will be inflation. So, there is a constant tension between, money creation on one hand and borrowing/taxation on the other to keep the economy at full capacity without high inflation. Nobody is suggesting a “free lunch” merely that the misunderstanding of the nature of money is leading to a sub-optimal policy.
Osborne cancelled interest on BoE owned gilts in, I think, 2013 because it made no sense and the BoE was accumulating inappropriate reserves, I think you will find
I agree with all the rest
The balance requires careful management as MMT makes very clear and the role of tax is vital
On Twitter, Kim Driver (knowledgeable ex-banker I follow) replied to your tweet about Debt and QE with the graph, saying –
“If you exclude reserve balances held at Bank of England……
Which you really shouldn’t given that HM Treasury has indemnified BoE against any losses arising from QE and receives any profits.
Consolidate.”
Is the reference to “consolidate” debunked by the point about QE never being unwound, or something else? He’s not alone in saying this, so perhaps it would be worth addressing? Apologies if you’ve already done so.
In this claim that central reserve balances about commercial banks are, somehow, the equal and opposite of quantitative easing is simply untrue
The central reserve balances did, undoubtedly, go up at the time that quantitative easing was first introduced, but both were a reaction to the 2008 financial crisis, and in my opinion are unrelated to each other, even if of roughly equal and opposite amount
The whole core issue that arose in 2008 was that the commercial banks would no longer lend to each other in the way that they had before that time. That was, of course, because they did not know what was on each other’s balance sheet, and how little liquidity each other hatd. This was the whole essence of the market crisis at that point in time. As a result central bank reserves were increased to ensure that each clearing bank could make settlement with another such bank without having to rely on facilities provided by the Bank of England itself. Previously they basically granted themselves credit, and now they did not. By convention the Bank of England has paid base rate on the central reserve balances, but there is no compulsion on them to do so. The idea that these reserves do then create a potential problem is untrue. And anyone who knows anything about banking, and interest rates, knows that for the long term there is no prospect whatsoever that anyone can currently imagine that rates will rise so this is a complete and utter storm in a teacup of no consequence.
This might help on reserves
https://www.bankofengland.co.uk/-/media/boe/files/ccbs/resources/understanding-the-central-bank-balance-sheet.pdf
Note that the BoE makes no link between QE and the requirement to hold reserves
Changes to monetary policy operations that required commercial banks to hold more reserves at the BoE predate the crisis and QE – it was all about modernising (reducing counterparty credit risk, recognising daylight exposures etc.) the system. Along came the crisis and QE and it just made sense commercially for banks to park excess reserves with the BoE – regulatory changes with regard to liquidity rules and sheer fear drove them to it. QE has a bit to do with it in the sense that if you pump money into an economy that is unwilling to spend/invest you should not be surprised that a lot of it ends up back as the BoE as excess reserves…. but I think it says more about the limitations of monetary policy in the face of a slump.
Frankly, I struggle to understand the worry people have about this. If we live in a world where rates need to rise you can be sure that banks will not be choosing to hold excess reserves at the BoE – they will have better things to do with the money so interest on excess reserves will disappear quite quickly anyway. Besides a rise in rates would imply an economic revival! Now that WOULD be a high quality problem to have.
We agree Clive
Thanks both!
I wish to draw attention to an interview given by James Anderson of the investment firm Baillie Gifford to Investment Week (IW). He said this: “The idea – fashionable in markets but a month ago – that central banks had no more ammunition approaching the zero-bound has been destroyed.” He also said this, while noting the unlimited scale of quantitative easing, a commitment to underpin interest rates near zero and collusion with the Treasury to pay for government activity. “How is this not modern monetary theory (MMT)”?
The short IW interview is here, under the title ‘James Anderson: The era of modern monetary theory has arrived: Stimulus the end of 40 years of ‘neo-liberalism” (David Brenchley, 15th May, 2020): https://www.investmentweek.co.uk/news/4015256/james-anderson-era-modern-monetary-theory-arrived/page/2
I think this is much more salient to the progress being made than any observation by an academic economist.
Thanks
That may get blogged
He does understand what it is…
That’s similar to the article about his views in the Herald, which was more focused on the UK –
“Boris Johnson and ‘lovely’ adviser Dominic Cummings will ‘not risk’ public spending clampdown, global investment guru declares”. I’m sure “lovely advisor” is ironic!
https://www.heraldscotland.com/business_hq/18489353.boris-johnson-lovely-adviser-will-not-risk-public-spending-clampdown-global-investment-guru-declares/
It’s a pity that he seems to think Spain’s UBI is connected to MMT, but he hits the right note on many other issues!
Also, my understanding is that Spain will not have a UBI – “In the words of Spain’s minister of inclusion, the minimum income guarantee is “completely the opposite” of so-called universal basic income. It will be means-tested on both the income and the non-housing wealth of potential recipients, and it will require recipients to submit a tax return.”
Blog tomorrow, I think…
I entirely disagree. The UK’s debt to GDP ratio will almost certainly breach the 100% barrier for the following reasons. As the UK economy shrinks even keeping the national debt steady will mean that debt as a pertentage of GDP will rise. In a recession tax revenues fall, and we know that the government had planned to have a deficit from april 2020 anyway. The furlough scheme is expected to cost 80 Billion pounds alone. If deflation comes along, that will increase the value of the national debt.
That’s an argument
With insufficient government action it could happen
[…] 2009 £635 billion has been injected into the economy this way. This is now by far the most important tool available to the Bank of England to influence the […]