I have already noted the new research byAnnette Alstadsæter, Niels Johannesen and Gabriel Zucman on tax evasion in Scandinavian countries published this week. I have now considered it in a little more detail.
The research can be summarised in this one chart:
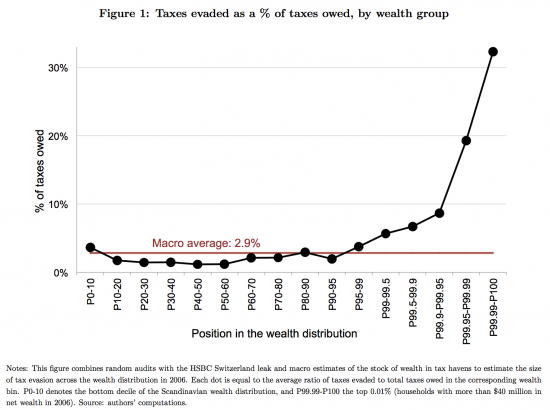
If true this changes the perception of who evades the most tax: these authors make it very clear that they think it the best off and that as a result all effort would appear to be best focussed on them.
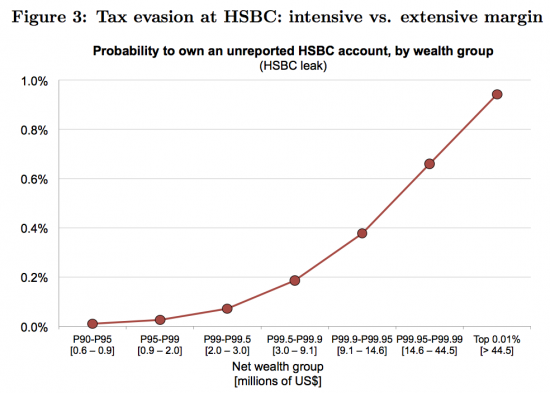
I am not disputing for a moment that the wealthy evade tax and far too much emphasis has been out, in the UK for example, on the fact that they only avoid tax because they do not need to evade. I strongly suspect they do evade, as do these authors note. Their table 3 shows that the chance that a person might have evaded using HSBC grew significantly with wealth:
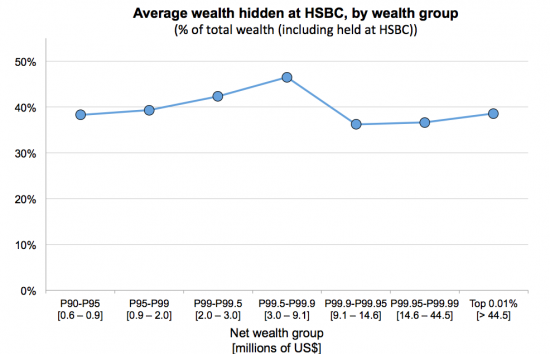
Their argument is, at least in part, that it only pays the banks to service the evasion of the wealthiest, especially when there is significant inequality. The average amount of hidden wealth was significant:
The above pattern was broadly repeated but was more exaggerated for the Panama Papers.
Overall prevalence of evasion is suggested by the percentage of the wealthy taking advantage of Scandinavian tax amnesties:
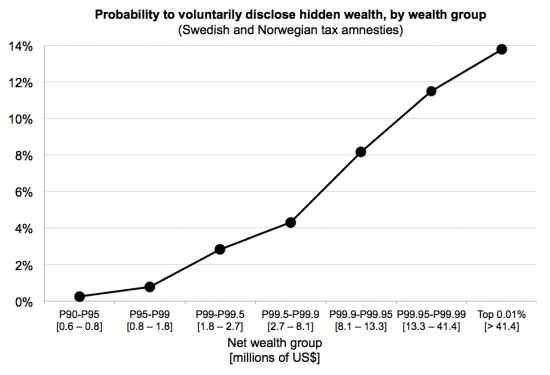
I am not terribly surprised by this: you need wealth to take part in a tax amnesty that requires that you pay your evaded tax. As wealth diminishes this ability to pay does too and voluntary disclosure is bound to fall as a result. But the trend and actual rates are notable.
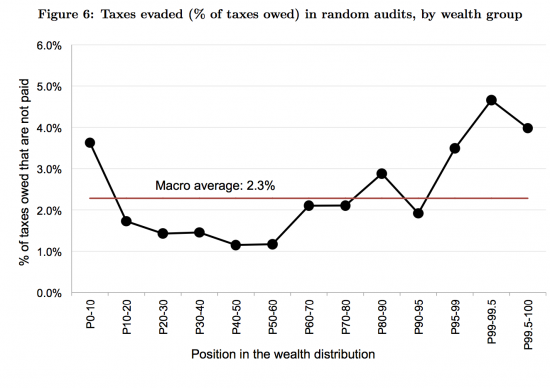
However, I want to return to the first chart and the suggested average evasion rate of 2.9%. I am struggling with this. The following is table 6 from their work which actually shows a lower rate based on tax authority random audits:
Now compare this result with the following charts that follow this one:
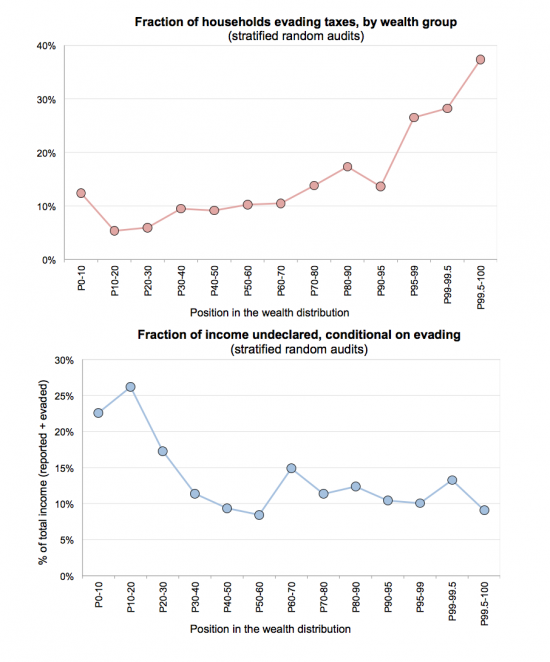
It would seem that figure 6 is a function of the following two charts. But what Zucman et al are assuming is that random audits, which they acknowledge do not work well in discovering tax evasion by the wealthy, do work well for the rest of the population. I do not agree with this assumption.
I would add in evidence that it follows from their work that if they think between two and three per cent of taxes are, on average, evaded then this is also the size of the shadow economy in these states.
There is contrary opinion on this. For example, Friedrich Schneider has argued that the shadow economy of Denmark might be 12% in 2015, that of Norway 13% and Sweden 13.2%. Schneider's work is not without its critics, but the EU estimates Denmark's VAT gap to be a remarkably similar 11.27%, albeit that it also thinks Sweden's is an utterly implausible (it has to be said) 1.24%. They do not, obviously, calculate data for Norway, but I suggest the Danish estimate is indicative.
In that case I think Zucman et al have done good work in showing that the wealthy are bigger evaders than thought but I suggest that their belief that tax random audits are reliable indicators of the scale of evasion in the rest of the economy is optimistic, at best. As such I suspect their numbers do not add up and more work still needs to be done.
Thanks for reading this post.
You can share this post on social media of your choice by clicking these icons:
You can subscribe to this blog's daily email here.
And if you would like to support this blog you can, here:


I am sure that tax evasion is much more massive than anyone can possibly think. Especially among the wealthy, almost all of who have got their wealth unfairly and do not deserve it.
That is why you are right, Richard, to accept those parts of this report that confirm this suspicion but reject as dubious those parts that do not.