Howard Reed has produced a new report for the TUC that combines government departmental spending plans announced in the November 2015 Spending Review with a range of UK household-level datasets on the use of public services by individuals and families to measure the distributional impact of the announced changes on services delivered to households. The findings reinforce the work that Ronen Palan and I did in October last year by showing that real funding per capita is falling across all public services — even in the ‘protected' areas such as policing and health.
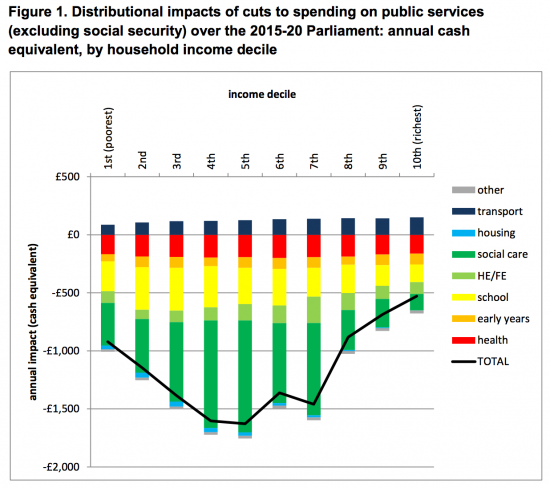
If figures are looked at initially as cash equivalents then this is the distributional impact:
But when stated, more relevantly, as a proportion of total household living standards (defined as household disposable income after taxes and social security payments, plus the value of in-kind public services) the picture changes somewhat:
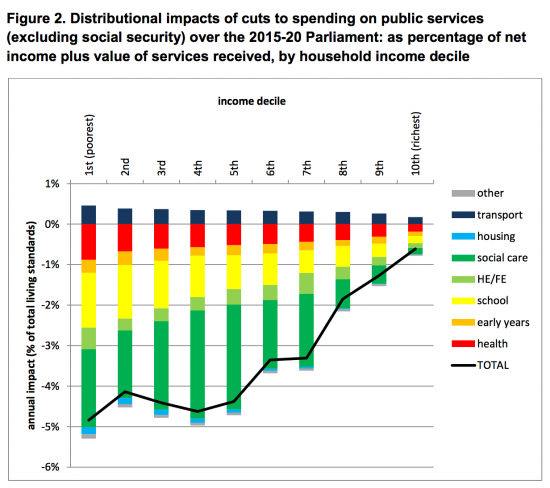
It is now clear that as a proportion of total living standards, the spending cuts are regressive; the lowest income decile experiences an average reduction in living standards of around 5 percent, while the 2nd, 3rd 4th and 5th deciles experience reductions of around 4.5 percent. Meanwhile, average losses for the top decile are less than 1 percent of living standards, and for the 9th decile only just over 1 percent of living standards. Spending cuts have a very regressive impact by income decile for all of the spending categories. And as this graph shows, this means that the lowest-income families will suffer a drop of more than 5% in their living standards between 2015 and 2020. And most low- and middle-income families will see a fall of around 4.5%. By contrast, those with the highest incomes will see a fall of less than 1%.
Cuts to social care and schools account for the bulk of the fall, with middle-income and poorer families far more reliant on these services than wealthier households.
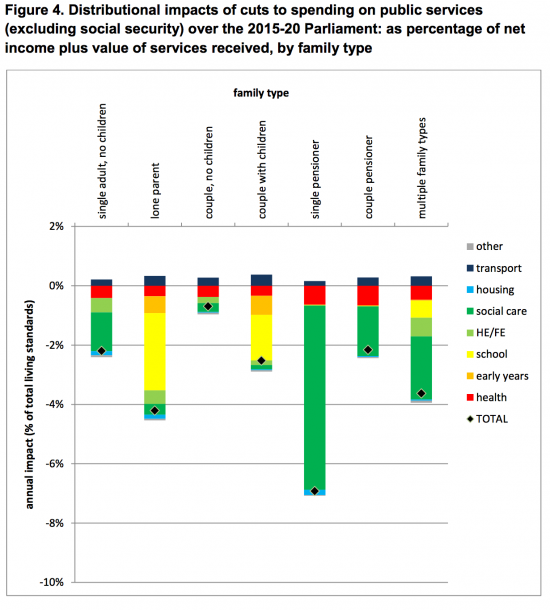
Cuts in social care and health mean that the impact is greatest for single pensioners, though lone parents and couples with children also face big falls in living standards due to cuts to early years and school-level education:
This is misery foretold, but not for everyone, as this final table shows:
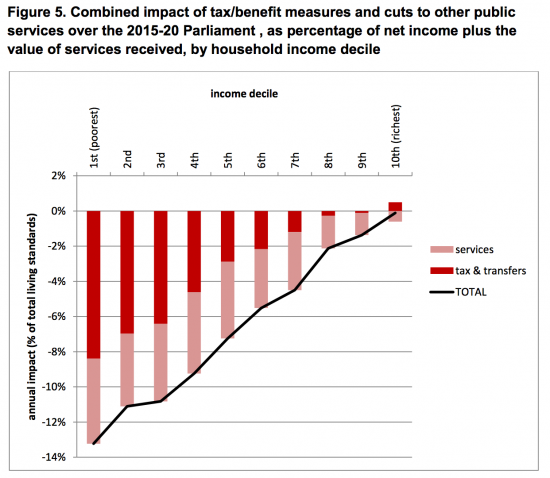
The government's proposals are profoundly regressive. My work is concerned with the way in which the tax system (and as consequence the social security system) can be used to relieve poverty. What this graph shows is that the exact opposite is going to happen over the next five years: regressive changes that will increase inequality in the UK will occur.
I cannot stress the significance of this enough: our society is already divided and it is set to get worse.
This, and not party politics, is why I criticise the government. It is impossible to have concern for the well being of this country and not be profoundly concerned at such a proposed outcome, in my opinion. Which is why I think this a profoundly important piece of work.
Thanks for reading this post.
You can share this post on social media of your choice by clicking these icons:
There are links to this blog's glossary in the above post that explain technical terms used in it. Follow them for more explanations.
You can subscribe to this blog's daily email here.
And if you would like to support this blog you can, here:

 Buy me a coffee!

Typo alert: ‘The government’s proposals are profoundly progressive’
Vital work from Howard- truly shocking but with a dumbed-down, narcoleptic populace and silent media how will it ‘get out there’?
Corrected!
Thanks
Howard spotted it in seconds and warned me
Interesting. It is no surprise: this is a political ideology. The government does not agree with you that this is a bad thing for the country, or that, for example, it is the government’s job to fund social care for the poor. It would just be helpful if they would be more upfront about making this argument rather than pretending they are maintaining the same outlook as in previous generations, which is obviously not true.
It would be possible to make an argument, without seeming like a complete ******, that said, for example, that the solution was to increase incomes – by job creation, more progressive taxation, more childcare provision, better education, living wages and appropriate levels of benefit so that instead of funding social care (or even health) people could spend their own money on it, and would have such money. I could see that those subscribing to the government’s ideology might believe this, but they have no made the argument clearly (yet) and nor have they set about making it happen in any convincing way.
This isn’t ideology, it’s just greed. They’ve created a false crisis as an excuse to flog everything the country has of financial value off to their mates. There’s nothing more to it than that.
Moving to a progressive taxation system for corporate income, dividends and capital gains would be a good starting point to reverse these trends.
It constantly amazes me how there is little or no discussion about increasing these through more incremental thresholds that will mean large corporate/dividend/capital gains will be taxed significantly more than small ones.
There is a constant Tory narrative to try to make all business/private wealth and income to be seen as the same (in order to maintain small business/self-employed votes) but in reality they are primarily rewarding their large financial backers for their political donations.
Looking at these figures and then considering the poor performance of the shadow treasury in interviews and how the look of panic spreads on their faces when asked about what would they do to balance the books, the answer is very simple:
Just put the money Osbourne has taken out of the economy since 2010 BACK into it and then you can start to ‘balance your books’ as the tax receipts come back in (with an added dose of proper tax collection from the corporations thrown in and some Green QE/PQE for good measure). They don’t have to do this forever, but it would be a good start.
I may be over-simplifying but I wish someone would say it!