![]()
I’ve already suggested today that there’s pretty strong evidence that living in a state which has a high overall level of tax is likely to increase your prospects of enjoying a high level of income.
Paul Krugman noticed another association a while ago:
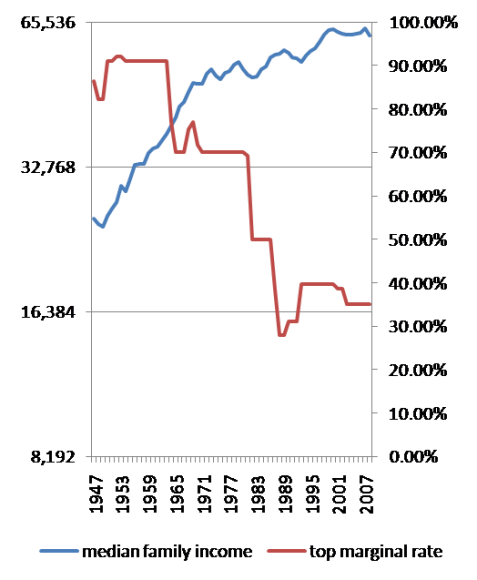
Here’s a rough-cut version. The blue line, left scale, shows median family income in 2008 dollars; the red line, right scale, shows the top marginal tax rate, a rough indicator of the overall stance of policy. Basically, US postwar economic history falls into two parts: an era of high taxes on the rich and extensive regulation, during which living standards experienced extraordinary growth; and an era of low taxes on the rich and deregulation, during which living standards for most Americans rose fitfully at best.

So, high tax = high growth, or so it seems.
Odd how the right deny it.
Thanks for reading this post.
You can share this post on social media of your choice by clicking these icons:
You can subscribe to this blog's daily email here.
And if you would like to support this blog you can, here:


Richard
Although I often applaude the rigour of your analysis, I hope you will agree that this is quite weak.
Putting two lines together does not show correlation and dependence. Even if correlation were shown to exist in this instance, correlation does not imply causation. http://en.wikipedia.org/wiki/Correlation_does_not_imply_causation
This goes against all principles of thorough statistical analysis.
@Hum…
I superficially agree
I say so in another blog today
But the above is not my work – kind enough as you are to attribute it to me
It’s the work of a Nobel Laureate in economics – Paul Krugman
I’m sure he knows what you say is true as I do
But before you get carried away with statistics – and its weaknesses – do recall that sometimes the bleeding obvious could never be proved using stats – which does not prevent it being bleeding obviously true
I think that’s what Paul is saying
So am I
How much of that rising median family income is an after-effect of the end of WWII?
And global economic growth was also higher in the period when the living standards of most ordinary citizens – rather than only of the wealthiest – rose consistently, Richard. In other words, when there was a general political commitment to increasing social and economic equality rather than increasing inequality we were all ‘better off’ (however we want to define that).
Furthermore, it’s pretty clear that as living standards for the majority of the population declined from the 1980s onwards credit and borrowing was used to compensate – hence the level of consumption and growth during the period to the crash in 2008 was actually artifically inflated. Now that particular mechanism for lubricating consumption has been turned off it’ll be interesting to see whether in the developed world we can ever return to consistent pre-2008 growth levels.
That said, I dare say that those of a neo-liberal bent will argue that if only we stick to their policies, as the rich get ever richer – and their number increase in places like India and China – so the degree of ‘trickle down’ will grow to such an extent that eventually the splashes might reach many of us. That, combined with the other side effects of an increasingly unequal world (starvation, increasing conflict, etc) should sort it.
Sir,
If this is true:
high tax = high growth
Why not put tax up to 90-100p, that would cause very high growth if you are correct in your assumption.
I think we can agree that the high post-war rates of 90% make little sense in the modern world – the actual argument right now is over 35% vs 40%. It’s worth noting that the top rate in the US kicks in way higher than ours – at around $250k – so changes in the rate will not affect median families directly. The effects are more subtle.
Incidentally, there is a fascinating series on the causes of US income inequality running in Slate at the moment – http://www.slate.com/id/2266025/entry/2266026/. Highly recommended.
Is there a reason why the median income axis is a logarithmic scale, other than perhaps to show the line conveniently levelling off?
And how do we know that continued high marginal tax rates would not have sent that line heading downwards?
(I know it’s difficult to believe that even economists get it wrong sometimes!)
@Neil Reddin
If median income grows at a constant rate (say 3% per year) then a linear scale would show an exponential (upward curved) line, whereas a log scale shows a straight line. In the context of trying to see whether a certain rate of income growth has been maintained over time, it makes sense to use a log scale.
Are online tax calculators such as http://www.taxcalculator2010.co.uk/ accurate enough to get a broad idea of my net salary once I’m in the UK?
@Ooki
I’m sorry
I can’t comment