The Office for National Statistics has issued a new report entitled “The effects of taxes and benefits on household income, 2007/08”. Not the most gripping title you might say, but the data is fascinating so I’m reproducing a whole series of tables from the report here, but would add there is a lot more still within the original.
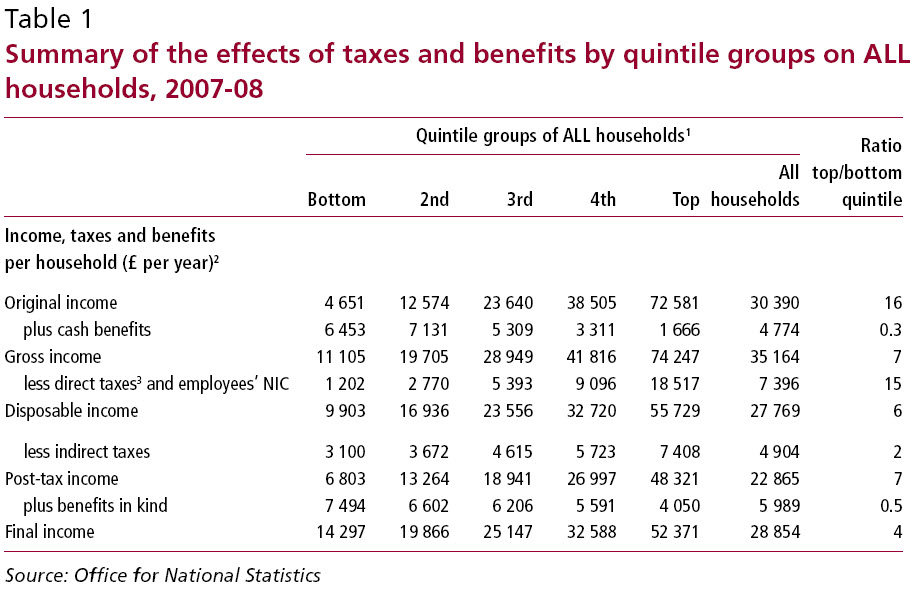
A quintile is 20% of households. Look at the massive disparities in well being this basic data reveals. Note too that whilst income tax is progressive that the impact of indirect taxes are very, very different in scale. It’s a theme to which I return, below.
Expressed as percentages the message is stark:
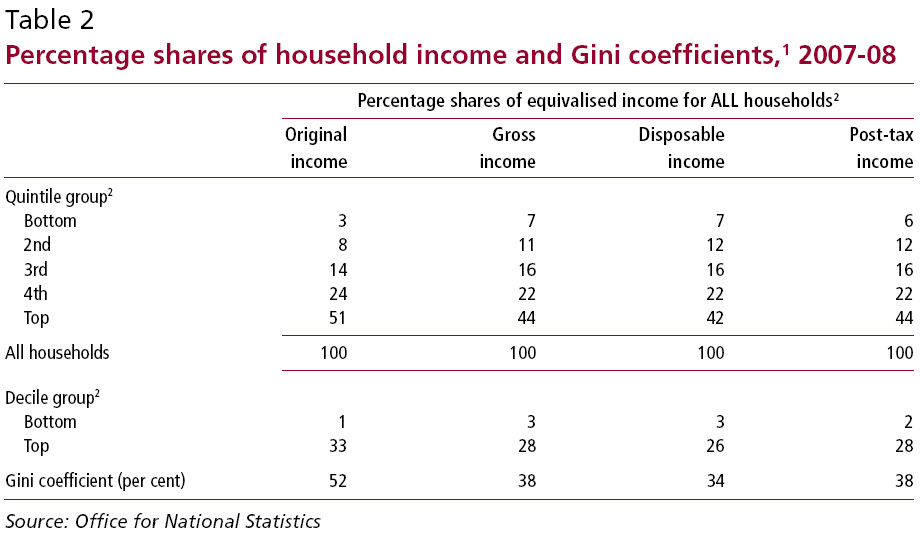
20% enjoy 44% of post tax income: 20% just 6%. That is more than a sevenfold difference, and using quintile data mutes the extremes. The decile data disparity is 14 fold. The Gini coefficient is a measure of inequality: 0 is total equality, 1 is all income goes to one person inequality. Again, I return to this below.
Looking at how tax breaks down is important:
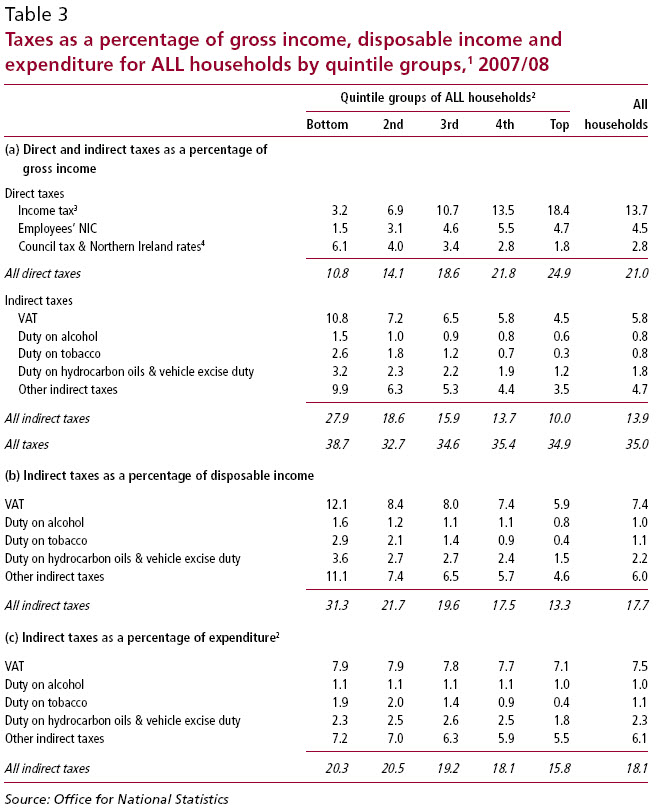
Council tax is blatantly regressive. So is VAT, as overall are indirect taxes as a whole. Is it any surprise that the Big 4 firms, the Institute for Fiscal Studies and other big business lobbying groups are so keen on them? They shift the burden of tax from the wealthiest in society to the poorest. Note that the effect is near enough the same on expenditure too: the richest spend less on consumption as a proportion because they, unlike the poorest, can save. The effect is that their saving gets a tax subsidy the rest do not enjoy. And so the wealth divide increases.
Looking at household characteristics is also telling:
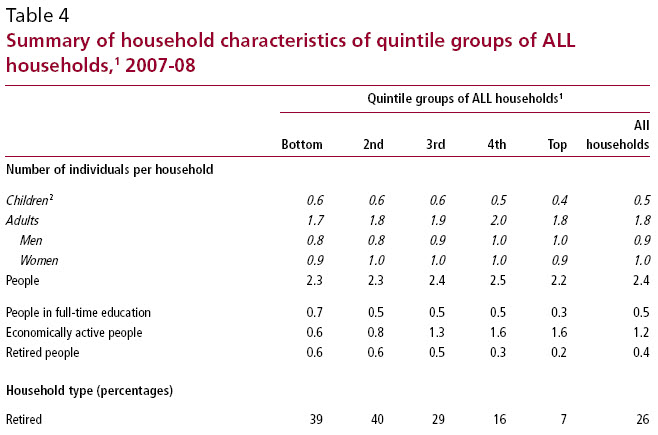
The wealthiest have the lowest number of children per household. It’s an issue I will return to later. Note too how the trend of those in full time education falls as one rises through the quintiles: this partly explains the move in the opposite direction of those who are economically active. Pensioners explain a lot of the rest. The combined figure for both in the lowest quintile is 1.3, in the highest it is 0.5. The difference in economically active is 1.0, but its clear when looked at this way lack of availability of work is not the major issue.
As noted above, the Gini coefficient measures inequality in a society. This is how it has moved:
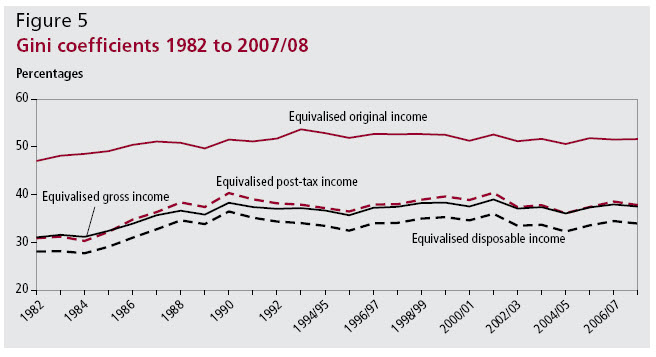
Tax and redistribution massively enhances equality in the UK, but not by nearly as much now as it did 25 years ago, and Labour has not done enough to reverse the travesty of the Thatcher years.
I was pleased to note that the ONS did exclude pensioners from some parts of the survey: they will always be worse off than those in employment. That’s a reality which is not going to be challenged for a very long time. This table refers to non-retired households.
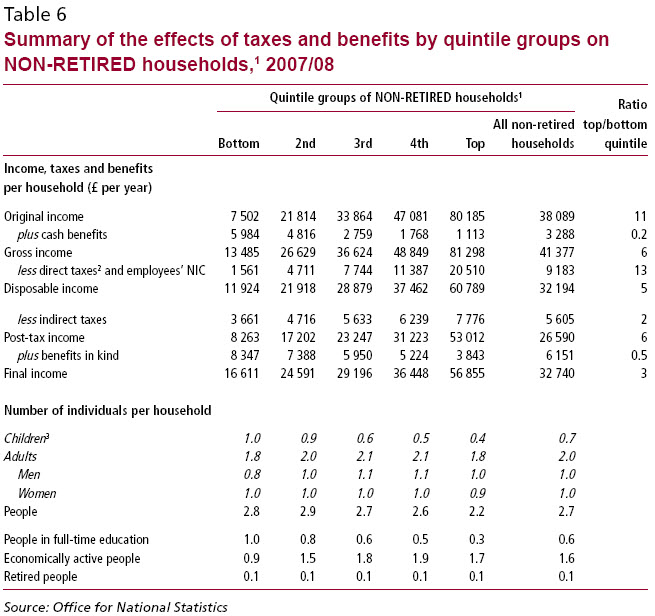
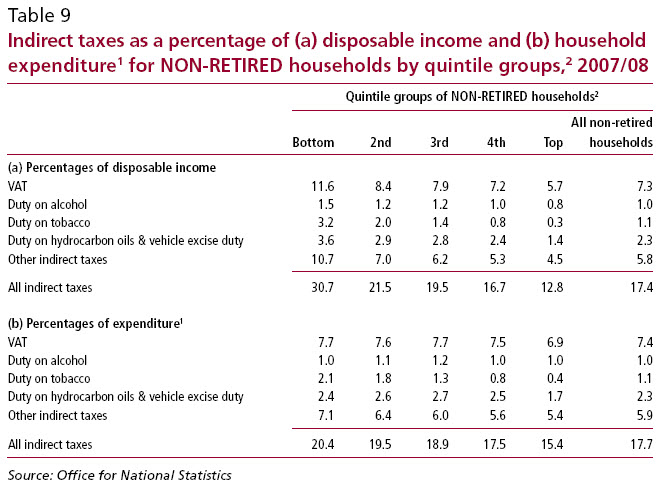
The disparity in children per household is now even more marked: 2.5:1 over the bottom to top quintile range. Disposable incomes are though, of course, on average higher. The regressive nature of indirect taxes remains just as marked though, as this table makes clear:
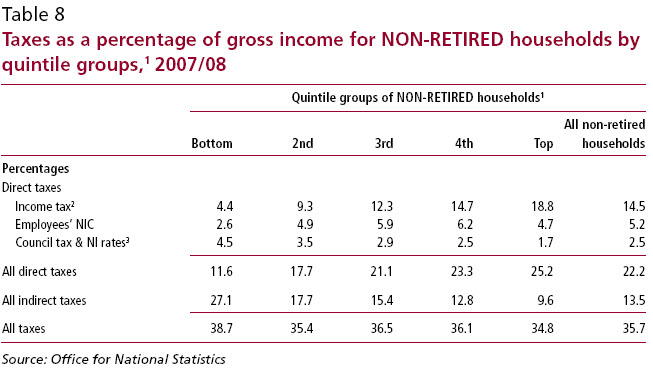
Here we have the real picture of UK taxes: overall a regressive system where middle and poorest pay most and the best off least. The argument for a more progressive tax system is extraordinarily compelling, if only to counter act these horrible imbalances in indirect taxes:
It’s also worth noting just what “benefits in kind” mean, because they form part of income noted, and therefore contribute to income redistribution. This is what they mean for non-retired households:
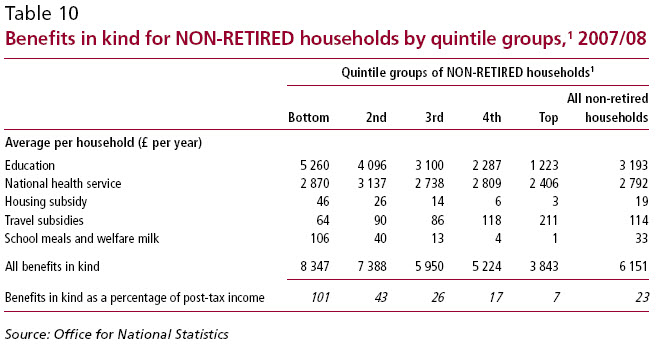
But before anyone shouts that the highest earning households take less education because they pay private fees, think again. It’s also because they only have 40% of comparable children per household compared to the poorest quintile. that is by far the biggest factor. As does population per household explain the NHS disparity where the subsidy per head in the poorest households is £1,025 whereas in the highest quintile it is £1,093. It’s a fact that the wealthiest know how to use the system to their advantage. As a result this subsidy goes most to the best off.
Conclusions
This data is powerful and gives a lie to much of what the Right say.
Tax in this country is regressive.
The best off have the best tax deal.
They also willingly use the system.
Inequality has risen in the UK. The tax system has encouraged that as it has shifted to indirect taxes.
UK indirect taxes are horribly regressive.
Those forms and lobby groups who argue for more indirect taxes and fewer direct ones are asking to increase poverty in the UK to benefit the wealthiest in our society.
The reality is that now is the time for progressive taxation reform — to make sure that the richest in the UK pay a fair share for the society we live in, because they do not right now. And that has to change.
Thanks for reading this post.
You can share this post on social media of your choice by clicking these icons:
You can subscribe to this blog's daily email here.
And if you would like to support this blog you can, here:


The effect of the tax and benefits system is to reduce a top to bottom quintile ratio of 16 in 4. That seems strongly progressive to me – more so than I would have expected.
I would like to see the bottom quintile (or even the top quintile) compared to the top 0.1% (including non-doms and tax exiles who spend enough time in the country to run a business)
Graeme
The top 01.% data is not available – unfortunately
It would be very telling
Even splitting the top decile by percentage points would help a great deal
Richard
Isn’t rather naive to look at raw data (fiscal incidence distribution) like this when what matters is the economic incidence?
Benefits like Housing Benefit and Council Tax benefit are economically incident mainly on the owner of the property (the welfare is passed to the landlord in higher gross rents). And Income Tax on the lower paid is passed through their employer to the customer and the shareholders. Income Tax on higher paid is not generally passed upstream as much (although it is for international soccer stars).
Also missing from this analysis is imputed income (eg from property), which is generally untaxed, including all income from directly owned capital.
So by disregarding tax and benefit incidence, income from land, property and personally owned capital, the ONS has produced a report that is so flawed it is worse than useless.
What are TRUK’s views on imputed incomes such as from private wealth? Is it right that the legal structure of ownership affects whether tax is payable or not?
Your report would have a lot more cred if it were to stop saying wealth is bad even if it has been justly earned. Or poor is good if you have not earned it.
If a rich person earns their wealth through hard work that is a good thing. They should receive the full return without stealing it in tax. If a poor person earns little because they prefer a quiet life that is OK too. Leave them both alone, stop spying on them, they have done nothing wrong. And visa versa for both and all in between.
Is it not true that when wealth as an unearned income from say the rent of land title, is what should be taxed to the hilt, immediately? The community has created that value, we are obliged to pay it all back by rights. And is it not true that what we produce with our own hands is the only thing we can rightly own, and therefore should be free from tax? All the other talk of tax is a wonderful palliative surely. BTW these monoploy rents approach £1Tr annually.
I fear you are confusing wealth with money. That is, if you can create more money from existing money, or that owning land and taking all the rent, that is more wealth. It is not. The common stock of wealth has not changed. It is just the power to command more wealth for yourself. A transfer of wealth from someone else to you. Wealth is NOT land nor money. You have confused the just creation of wealth with the unjust. But you have not separated these into the just and unjust components and naively say to tax all of it.
Robin
Anyway who says tax is theft has no credibility at all
All property rights are dependent upon the state or violence
I assume you do not advocate violence
The same state that creates your legal property right does using the same power say you pay tax
So why is one legal and one not?
Of course that is not possible
So very politely, stop talking complete nonsense and stop telling me I’m confused: I think it is you who needs serious help with your delusions – because that is what they are
Richard
Richard,
There is so much more confusion now in your response. I’d stop while the going is good.
You can only own what you create with your own hands. Stealing it doesn’t mean you own it. Why on earth do you assume this? Most strange
Nope. I did not say tax was theft. I said stealing a persons property was theft. That is not taxation. The state is stealing unjustly from the people. And giving out free gifts unjustly to others who are privileged. Do you own land? Then you are a perpetrator too.
Property rights are not dependant on the state. They are dependant on natural law. Hopefully the state will operate in harmony with that. If not, society will decline. We can see this repeatedly, in fact. Denial of this is cognitive dissonance.
A state that allows you to steal others justly created wealth and get away with it, or itself steals from the people who create that wealth, is unjust and will ultimately decline.
The law is the will of the powerful. It is not justice. I never said anything about the law. I wonder why you are jumping to conclusions. Can you explain please?
Very strange #2: You attempt to insult and then say you are doing it politely. I’d rather you just say what you mean, you won’t hurt me.
You are indeed confused about wealth. Its down to you to come to terms with that. Your confusion falls into the category of a neoclassical economist. Very strange #3. You really do not understand the meaning of wealth.
Robin
Sorry – I could, but won’t bother to explain
I’m afraid I engage with the realistic, not the fantastic
And you’re in the second camp, in my opinion
And I don’t waste my time in that domain
Richard
Robin, wealth is created by labour using land, not by the owners of capital – but these are the people who comprise the wealthiest of all. No one can become super rich from their own efforts alone – not even Bill Gates. Yes, the appropriation of rent for private benefit is one of the problems which is not acknowledged by economists, but equally, the acknowledgement of the appropriation of surplus labour only lies with the Marxist tendency.
Richard is quite right to point out that taxation is not theft. It is not theft solely because it is not unlawful. But just because it is cast into law doesn’t mean it is morally right or economically wise – the UKs tax system is neither.
Robin is right however to raise the issue of economic privileges and (monopoly) rents. Aren’t these the ultimate sources of taxation, regardless of how and where tax is levied?
It’s unclear exactly what TRUK is advocating, but it seems to prefer Income Tax and Corporation Tax over VAT and Fuel Duty, based on purported pro/regressivity. I’d like to hear more detailed justification and clarification for this though.
Is TRUK saying that Fuel Duty is regressive (because it hits ordinary drivers)? Or progressive (because it hits shareholders of petrol retailers)? Or what?
If TRUK is talking about indirect taxes, tax incidence is implied – and some taxes are shifted upstream to suppliers (eg VAT on MSWindows), while others are shifted downstream to customers (eg VAT on petrol).
A deeper analysis is needed from TRUK!
Adrian
I’d take your comment a little more seriously if you could explain to me why VAT on MSWIndows is a charge on suppliers
Do you know how VAT works?
Richard
[…] needs to read this. Because numbers don’t […]
“If a rich person earns their wealth through hard work that is a good thing. ”
Quite possibly. Though we may want to ask “how *much* wealth should a rich person hold, even if it’s all purely from hard work?” After all, what if there was one rich person who through sheer hard work earned £10 billion, and everyone else in society only earned £10.
What if everyone else in society also worked really, hard, but got unlucky and that’s why they end up with only a litte?
What if everyone else is only earning £10 *because* that one rich individual (even though he worked hard) is earning £10billion (i.e. what if there is a causal connection between his wealth and their poverty?)
And furthermore, how many rich people in our society do you think there are? And how many of them got their through hard work? How many had large inheritances, or well-placed fathers, or were just very lucky? Why do you equate wealth with hard work?
You see, Robin, all your sentences are like this. Loaded with assumptions…and you don’t seem to realise.
I could give the above treatment to all your sentences. But it would take more time than i’ve got. You need to think a lot harder about the assumptions underlying your desire to apologise for the wealth of the few at the expense of the many.
I’m happy that you ask this question, Richard. 🙂
As you know, suppliers choose the prices they offer goods in the market to try to maximise their profits. VAT of course is about 13% of the selling price in the UK. The question is what happens to the prices, quantities and economic surpluses of the goods in question (and all the other goods) when VAT is introduced to increase government spending. There is a “short run” effect as the producer chain and consumer of the goods in question change the price and quantity in the market. And there is a “long run” effect as gross wages, investment, interest rates etc adapt (as well as long run adaptation in the particular marketplace).
On goods sold by suppliers in competitive markets (many buyers, many sellers etc), the effect of introducing VAT is to scale the supply curve by the VAT rate (1.15x). The short-run response generally is to increase the post-tax price producers charge in the market a bit and the buyers reduce the quantity supplied a bit.
To determine how much the price and quantity change in the short run, you need to know the relative elasticities of produce and consumer. Inelastic short-run demand (such as for petrol) results in the price rising roughly by the amount of the VAT on the goods while the quantity bought is slightly lower. The buyers lose in two ways. Firstly (and mainly) they pay more per unit for what they buy and second they are forced to choose inferior alternative actions (eg drive less, walk more). The suppliers take a slightly lower price in the market and deliver a slightly lower quantity. The consumers bear most of the burden in the short run while the producers are relatively unscathed.
If the producer and consumer elasticities are of similar magnitude, they will share the burden of VAT more equally. The producer is generally a business, and some of the burden will be shifted to the business owners, and some may be transferred to the executives and employees in the short run (lower wages, bonuses).
In the case of a product which is priced by a skillful monopolist (Microsoft Windows), the price has been set in the marketplace such that the revenue is maximised. Introducing the VAT on this product has no direct effect on the demand curve for the product, hence the optimal price the monopolist chooses is unchanged. The consumer consumes the same quantity at the same price. The net revenue of the producer chain is reduced by the amount of the tax paid (about 13% of the total), and this burden is transferred to shareholders and employees. This is why VAT on MSWindows is incident mainly on Microsoft.
In summary, in the short run, VAT is a burden on monopolist suppliers and/or inelastic consumers.
In the long run, things get a little more interesting. Firstly wages adjust. So in the case of inelastic petrol consumption (driving to work), wages may adjust upwards. Employers and employees will relocate. Secondly (and more importantly), business rents and housing costs will adjust. The lost profitability at monopolistic and inelastic suppliers will mean they can’t pay so much for their premises (commercial landlords will lose out). And the extra burden on employees paying VAT on the petrol to go to work will mean they can’t pay so much to rent their houses or pay on their mortgages. Owner-occupier businesses collecting large location rents (eg Tesco) will carry the burden too (in their capacity as landowners).
In summary, the long run effect of introducing the VAT will be a fall in business and home rents and a corresponding fall in the fair price of real estate. Wages will shift, but the net burden on the ordinary (non home-owning) worker will be minimal. Homeowners and commercial landowners will suffer a big hit in their overall “endowments” as the transferred VAT and loss of business turnover is capitalised onto (lower) land prices. This probably takes a decade to play out fully.
Another way of looking at it is simply to examine the economic rents. Competitive consumers, producers, and ordinary labourers have little economic rent whether VAT is levied or not. Introducing VAT can’t possibly be a burden on these groups except where they change group (eg cease being producers, become unemployed etc). Monopolists, innovators, resource owners and those benefiting from land titles have most of the economic rents, and the burden of VAT must be incident on them in some combination.
The “good” news from TRUK’s perspective is that VAT ends up being a tax mainly on the wealthy – just an extremely erratic and inefficient one. The distribution of economic rents is much more skewed than even income. It may be more focussed on the wealthy than income tax (because income tax partly ends up on the rents that high earners hold).
A serious confounding effect arises if the government actually spends the VAT revenue efficiently on something useful (better schools, transport and hospitals). The value of being near these facilities exceeds the cost and the economic rent of the land rises by more than the negative contribution on land values from the VAT. Overall, introducing VAT and spending it wisely on public services has a negative net burden which is incident on people who owned land *when the tax was introduced*. In other words, the wealthy get much wealthier while the poor are a little better off. Inequality rises because government *spending* gives benefit concentrated on the wealthy. The tax system is not the main culprit. And you can’t expect to levy a “fair share” tax on income if the benefit of the tax is then channeled into resource rentiers’ pockets since the rentiers are different from and more concentrated than the income earners.
Of course, some of the economic burden of VAT is transferred overseas as reduced demand cuts prices or quantities for imported goods and raw materials. Indeed some people advocate charging carbon taxes in oil importing nations so as to export the tax burden to oil exporters (see the excellent “Carbonomics” book).
As I suggested, you simply can’t analyse the distribution of the burden of indirect taxes without doing some assumption or analysis of tax incidence. Tax should always be analysed as a burden on natural persons and indirect taxes are collected from businesses. Identifying the long-term connection from businesses to natural persons is the crucial step missing from the ONS and the TRUK analyses.
I know this analysis is a bit long-winded, but the conclusions are completely at odds with your analysis. Where do our understandings diverge? Perhaps the difference is between the systemic versus the accounting approach?
For the avoidance of doubt:
> Conclusions
> This data is powerful and gives a lie to much of what the Right say.
OK.
> Tax in this country is regressive.
this is a bit too simplistic. Repressive maybe.
> The best off have the best tax deal.
definitely
> They also willingly use the system.
yes
> Inequality has risen in the UK. The tax system has encouraged that as it has shifted to indirect taxes.
Inequality has risen. But this has been from increases in overall taxation (and hence improved government services), the abolition of domestic rates and the liberalisation of financial services (read expansionary monetary policy feeding asset price inflation).
> UK indirect taxes are horribly regressive.
again too simplistic.
> Those forms and lobby groups who argue for more indirect taxes and fewer direct ones are asking to increase poverty in the UK to benefit the wealthiest in our society.
I think in the long run it’s a bit of a wash. Income Tax and VAT should both be scrapped. Welfare policy has much more effect promoting poverty through conditionality and means tests.
> The reality is that now is the time for progressive taxation reform — to make sure that the richest in the UK pay a fair share for the society we live in, because they do not right now. And that has to change.
Definitely.
But don’t expect an income tax to tax the rich. Income and riches are rather different. We have no richness taxes, so if you want one you’d better devise one!
The bigger question is what is a “fair share”. I’d say a fair share is proportionate to what you take out of the economy. What you put in to the economy is not a rational basis for levying a tax – in fact it’s quite perverse. Neither direct nor indirect taxes measure what you take out. Advocates of indirect “consumption” taxes may believe they tax what is removed from the economy, but this is just naive.
Luckily, there is a convenient, direct and rational basis for measuring and taxing what is taken out of the economy – economic rents. Resource abstraction rents (oil/coal/gas/fish/water) and land rents (taking land out of public use into exclusive private use). Collecting these rents for public purposes has been advocated for millennia by economists and philosophers. It works. It’s simple, stable and stabilising. But changing the existing system needs very careful analysis.
The first step to reform must be to understand what’s going on. TRUK should be at the forefront of the analysis!
Adrian
Oh dear, here come the Georgists
How many times do I have to say that playing gold with just one club is really not a very bright idea, and placing all your faith in just one tax base has about the same status?
But let me go back to my original question. Your analysis is of a sales tax. Would you now like to analyse a VAT?
Richard
> Oh dear, here come the Georgists
Can we avoid ad hominem attacks/name calling please?
I thought you might call me one of “the Incidence Brigade”. And I thought you might call me “far right”. Or perhaps “far left”. I’m more interested in the analysis than the labels.
> How many times do I have to say that playing golf with just one club is really not a very bright idea, and placing all your faith in just one tax base has about the same status?
It seems perfectly reasonable to me to have just one tax base. Very many businesses rely on one just revenue base (eg consumer sales revenue, or licensing revenue or whatever). Playing violin, tennis or croquet with just one instrument, racket or mallet works just fine. Analogies only go so far.
A Carbon Tax, a Land Value Tax, a Landfill Tax, an Aggregates Levy, an Excise Duty on tobacco and alcohol, spectrum licensing revenue, an Insurance Premium Tax and charges on patent grants and city centre parking doesn’t sound like “just one tax base”. The common themes of course are resource scarcity rents and external costs. And some say they a lot smarter than your choice of only one tax base of economic production/trade through Income/Corporation/VAT/Stamp/NIC taxes.
Anyway, doesn’t it make sense to eliminate redundant taxes? For example collecting both National Insurance and PAYE on wages is redundant, isn’t it? If there is basically only one tax base (economic rent), as some contend (ATCOR), trying to use a range of other tax bases is likely to confuse and have unexpected results (as we observe).
As regards your original question, my analysis *is* of a VAT. That’s why the analysis goes back to producer chains (eg miner, manufacturer, distributer, retailer), not just individual businesses. From an economic perspective, VAT is rather like a sales tax levied on final consumer sales. Is there any part of my analysis which only applies to a sales tax but not VAT?
Going back to the previous contention – VAT on Windows is incident mainly on Microsoft shareholders. Do you agree now? Is this plausible? If not, who do you think it burdens?
The unanswered question is which tax incidence model do you apply when you map indirect taxation from taxable entities to natural persons? You consistently apply flypaper theory for personal income tax, but this cannot apply to VAT.
As one of the premier tax commentators in the UK, you owe it to your audiences to go beyond the superficial analysis of politicians and news pundits. On the mechanics of tax, you are very clear. On the economics, that clarity is missing.
Your idea of moving towards progressive direct taxation of income from indirect is worth considering carefully. But you haven’t yet attempted to explain your proposal in terms of the basic economic shifts. Would *you* like to try to analyse a VAT yourself if I am unable? Or a progressive Income Tax, for that matter?
[…] are the conclusions Richard Murphy derives from a detailed analysis of tax injustice in the UK. · About the author: · Other posts by Newswire · About this article: […]
OK. I’ve found the model you are using in another blog entry:
http://www.taxresearch.org.uk/Blog/category/vat/page/2/
“VAT is quite clearly a tax upon consumers. Any tax on turnover is paid by consumers. Whatever we argue about incidence, in this case I think that is clear.”
This may be clear to you, but is not clear to me. You are using what you might call a “downstream-only incident/flypaper model”, the same as the ONS, interestingly. This seems to be at odds even with the Wikipedia entry on VAT which shows a reduction in the net price (received by the producer) *and* an increase in the after-tax price (paid by the consumer).
Evidently it is *not* “clear” that the incidence is solely on the consumer, since Wikipedians seem to believe incidence is shared.
Perhaps you can enlighten us all on another question? Why is there so much confusion and disagreement on this issue? If it is so contentious, why do non-economists tend to treat it as at taboo subject and look the other way?
One explanation for incidence being taboo is that it can’t easily be turned into populist rhetoric everybody can understand. Another explanation is that vested interests support analysts that neglect incidence. I note that Tax Research LLP (on whose behalf this blog is written) works for governments, charities, accountants and trades unions – all of which have constituencies to represent.
You say you “do not dispute incidence”. You are deeply concerned with how the tax burden is distributed. So let’s hear some detail of your analysis!
Adrian
Your urgency does not alter my convenience
I admit I have remarkably little time for your style of analysis – which relies on heroic assumptions, not least that the issue is of micro proportion when it is of macro scale
I’ll get to it
But because it’s my belief that this type of analysis does not and should not alter policy outcomes, forgive me whilst I concentrate on those that do
I will not ignore the issue – but I’ll reply in more detail when I choose
Richard
@Robin Smith
“Property rights are not dependant on the state. They are dependant on natural law.”
WTF is “natural law”? Anything to do with these people? If the state didn’t exist to enforce your property rights, I could turn up with some scally friends and ‘claim’ your property as my own. This is basic stuff – even some Libertarians are aware of this.
Righard, I am aware the data I would lie to see is not available. I was just saying it would be nice to know.
Windows is a bad example as Microsoft has monopoly pricing power, so the effect of VAT would be split between MS and customers, whereas in a perfectly competitive market it would be entirely passed on.
How does this give lie to what the right says? As far as I’m aware we say that tax is too high and should be lowered. We’re not much fussed whether it’s on the rich, the poor, the middle or whoever. We all pay too much tax.
By the way, if you want to look at how good the left has been, tax paid as % of gross income for the lowest 10% was 44.0% in the 97-98. This is now up to 47.7% for the lowest 10% in 07-08. Now which party has been in power for those 10 years?
You assert that Tax Avoidance, the lost obligation on people to pay for public services, is wrong.
But is is legal
I assert that confiscation of peoples wages, the only thing we can rightly own, is wrong.
But it is legal
Isn’t it true that either both of us are correct or neither of us are?
Can we have it both ways, Based only on a latent political decision we have made in our own special interest?
Is it not true that until we start to think, for the first time, about the principle ideas at the heart of economic justice, prior to making these political decisions, we will be doomed economically?
This is shown in actual fact, that a small child could understand. Yet we self proclaimed experts cannot see it yet.
Are you willing to accept that what I am saying is possible. Because I am willing to accept that what you are saying is possible. I’m calling for you to enter into a serious and respectful dialogue. To start putting principles before politics.
Are you willing to make that leap?
Robin
I do not deny I am political
But I’ve always argued from first principles
Which is why I say your argument that tax is theft is absurd: either we have property rights or we don’t, and if we do the source of property rights cannot act illegally in imposing, using the same authority the right to tax
Your position cannot be the starting point for a serious debate: no one wastes their time in serious debate of a fallacious argument
Please waste your time elsewhere
Richard
PS Please also note that there is no connection between ‘legal’ and ‘right’. Start with apartheid if you want the evidence