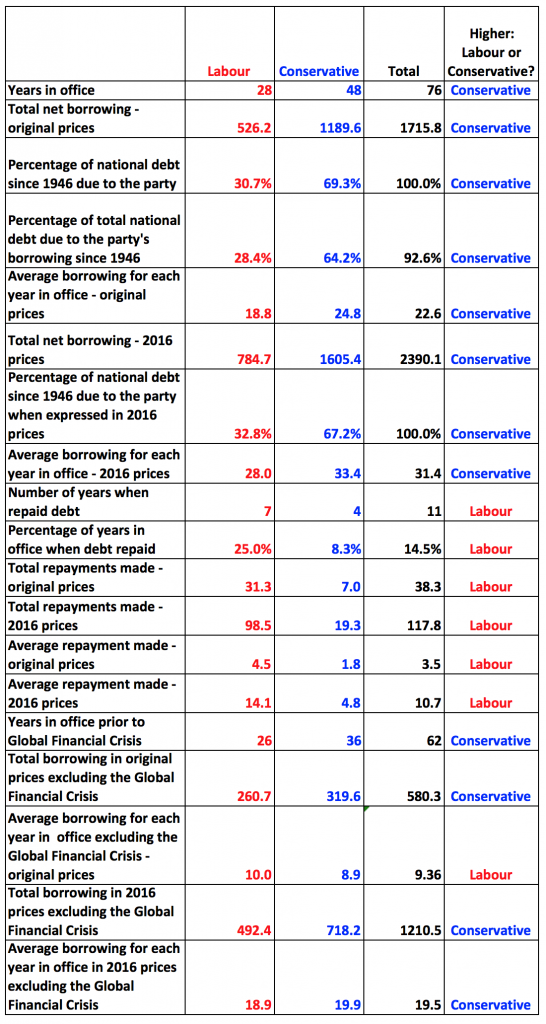
Philip Hammond said that the Conservatives were still clearing the mess that they inherited from Labour during the budget speech last week. That annoyed me. In 2016 I showed that the Tories have been the biggest borrowers since 1946. I thought it worth updating the data: it now covers the years 1946 to 2022. I do as a result include the latest budget borrowing forecasts until 2022, which is the expected time span of the current government. Since I know of no-one who doubts borrowing will continue until then I think this entirely fair. The data does now, therefore, cover 76 years. Labour was in office for 28 of these years and the Conservatives are expected to be for 48.
My first task was very simple: I calculated the total net actual or expected borrowing in Labour and Conservative years. All figures are stated billions of pounds in all the tables that follow and are in original values i.e. in the prices of the periods when they actually occurred, unless otherwise stated:
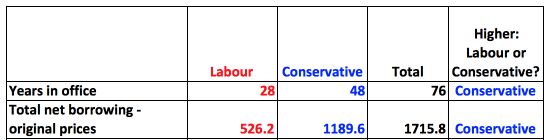
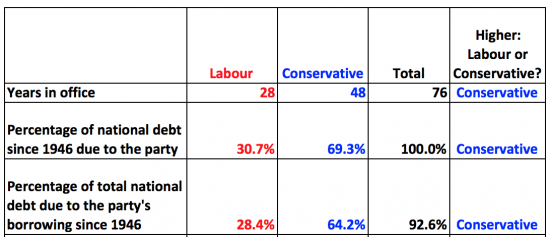
The message is very clear: the Conservatives have borrowed much more than Labour. This is clearly shown by looking at the proprtion of the national debt due to each party:
To make sure this impression of Conservative excess is not distorted by the fact that they have been in office for more years I averaged the borrowing data by the number of years in office:
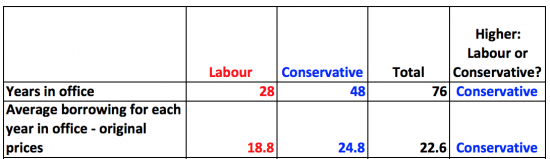
The Conservatives borrowed more, not just absolutely (which is unsurprising as they had more years in office), but on average each year during this period.
This though, is a bit unfair: the value of money changes over time. So I restated all borrowing in 2016 prices to eliminate the bias that inflation might give rise to. This resulted in the following table:
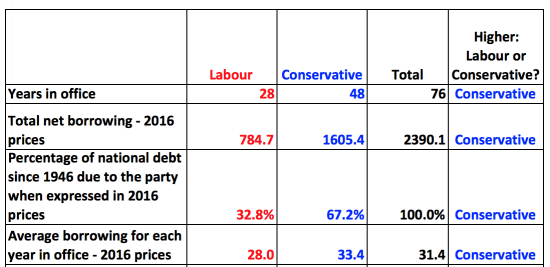
The Conservatives still borrowed more in absolute terms by a considerable margin, still created more than two thirds of the national debt and still borrowed more per year, on average, even when inflation was taken out of account.
I am though, of course, aware though that the Tories claim that they've only had to borrow in recent years because of the mess Labour made in 2008. To address this issue I then re-performed the calculations taking all the years after the Global Financial Crisis out of account, leaving just 62 year of data to consider. First I did this in original prices:
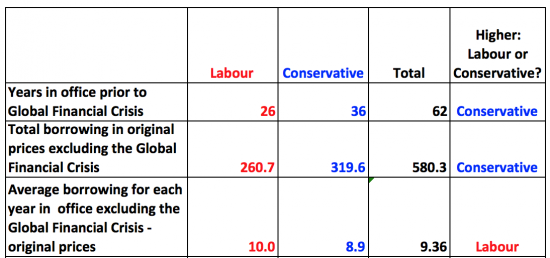
So. it's true that Labour borrowed more than the Conservatives before 2008, but that on average the difference is very small indeed: Labour borrowed just 12% more per year, on average.
To check that this impression was fair I also restated the data in current prices:
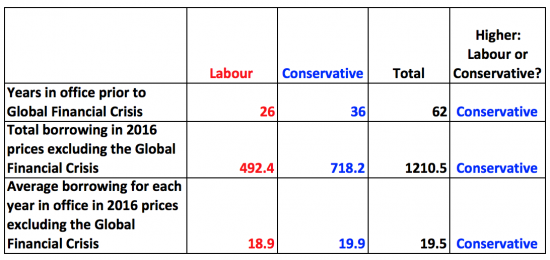
Now the situation has reversed: the Tories were, in fact, the biggest borrowers for each year in office, after all.
Then I speculated that this switching of roles might be because Labour are good Keynesians: maybe they repaid national debt more often than the Conservatives. Or, to put it another way, they actually repaired the roof when the sun was shining as George Osborne would have had it. This is the data in terms of number of years: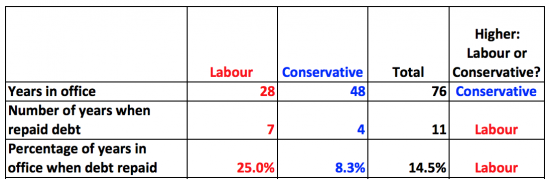
Labour do walk the talk: they repay national debt much more often in absolute and percentage terms than the Conservatives do. In fact, one in four Labour years saw debt repaid. That was true in less than one in ten Conservative years.
But maybe the Conservatives repaid more. I checked that. This is the data in both original and 2016 prices: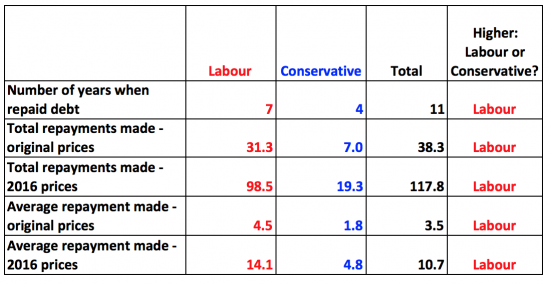
Labour not only repaid more often, it turns out it also repaid much more in total and on average during each year when repayment was made.
So what do we learn? Two essential things, I suggest.
First, Labour invariably, in real terms, borrows less than the Conservatives. The data shows that.
And second, Labour has always repaid debt more often than the Conservatives, and has always repaid more debt, on average.
Or, to put it another way, the Conservatives are the party of high UK borrowing and low debt repayment contrary to all popular belief.
For those interested, this is the overall summary table: the pattern in the right hand column is really quite surprising. The evidence that the Tories are the UK's big borrowers is very strong:
Data sources
The basic data on borrowing came from the House of Commons Library.
GDP deflator data from 1955 came from the 2017 budget GDP deflators. Estimates post 2016 come from budget data. The data for the period prior to 1955 came from the Bank of England. Data was checked to the Treasury Pocket Data Book: as is usual there are minor differences, but too small to worry about. Budget data is from HM Treasury and the Office for Budget Responsibility.
Governments in office for a year were determined in election years by the number of days each had in office: the party with the greater number being attributed the whole year.
I have previously checked that lagging data by two years to allow for the influence of previous incumbents during the first two years in office does not alter the view given: it does not.
The results here are slightly different to that reported two years ago in respect of earlier years. That is not because I got the data wrong then: the source data is subject to periodic checking and recalculation and this has happened in the last two years.
Thanks for reading this post.
You can share this post on social media of your choice by clicking these icons:
There are links to this blog's glossary in the above post that explain technical terms used in it. Follow them for more explanations.
You can subscribe to this blog's daily email here.
And if you would like to support this blog you can, here:

 Buy me a coffee!

What have the conservatives done with all this borrowing as there is no evidence of the money being used for the country’s assets for the welfare of it people
That is not true: the money has been used to fund government
Of course that has benefited people. You would not have an NHS and much ore without it
There is not enough investment, but it has paid for public services
I understood his point to be that the Tories borrow more but give us, the public, less.
I sense behind Rod Oakey’s comment lies a factor that many feel is notable which is that Tory higher borrowing does not keep public assets public nor services adequately provided for. Tory borrowing does not provide on a £ for £ basis because of a non-Courageous contrivance of circulating the public spend (and therefore the public borrowing) into the hands of the wealthy. Decades – and especially the blatancy of the current decade – of Tory borrowing highlight that the Tories first and foremost use the borrowing-economy as a wealth-upwards distributor with its real purpose being a mixture of pesky nuisance because they have to do a bit of proper governing, and handy convenience because it provides a vehicle to rig their sysyem.
Couple this with post-2010 Labour themselves not able – and it seemed not willing – to articulate their handling of the economy. In my view, this is an overlooked absolute weirdness that needs scrutiny. I won’t open that can of worms further here other than saying its massively connected and to create a new economic narrative with rely understood and accepted it needs to be included.
Because at the core of the problem of wasteful borrowing/underfunding and economic illiteracy is the existence o neoliberalism in two (well three) parties. And why even now TV and radio economic analysis is illiterate often with an open-mouthed stubbornness to accept the most obvious proof that old-style economic understanding is debunked.
The neoliberal ideology is at last under threat. But it is the fact that it has roots buried deep across spectrums and systems which continues to be nuisance. Across parties It in essence an Anti-Keynsian Pact.
The analysis from Richard here excellently explains a narrative that is being built to achieve change. I am sure for many of us it will be referred to time and time again as a ready reckoner.
Who benefits the most, the working class or the boss class?
I have read about the Tory propensity for creating debt and leaving it unpaid for the next Labour Government elsewhere from a number of sources. And I say this in support of your post.
The Tory reputation for being good managers of the economy is a joke. But it survives because spending debt makes people and society feel wealthier. But as we know, there is always a day of reckoning and it is all ‘funny money’.
No, PSR, there is no “day of reckoning”.
This is a neo-liberal trope, intended to scare the children.
Given that the “National Debt” is no more than the accumulated savings of the non-government sector – and yields, as such, simply benefits for the wealthy – it’s no surprise that Tories have increased it, as they and their interests will be the largest holders of Gilts.
So, there is no likelihood ever of a day of reckoning – why would Gilt holders seek less debt, i.e. less opportunity for risk-free savings?
The whole gov borrowing thing will trundle along, hopefully ad infinitum…
If anything, the deficit and debt aren’t high enough, especially right now when higher spending is essential, but being denied.
I fear, PSR, that you are perhaps conflating government and private debt in your comment.
If your last para concerns private sector debt as opposed to public debt, then I agree.
Mr S
I suppose I meant all debt – and the artificially manufactured and opportunistic orthodoxy that currently dominates it. The ‘day of reckoning’ is austerity – where the government pretends it does not have the money for public services because it has bailed out the rich again.
The day of reckoning in private sector debt is when the debts dominate real income and suppresses spending in the wider economy or just when the credit bubble pops for some reason (usually some form of ‘irrational exuberance’ or fraud).
Correct me if I am wrong but is this not a mixture of what we just lived through in 2008?
That’s part of the game that Liarbour plays very well and why so many rich people are upset at the irruption of democracy in the partei. If the fascist wing of liarbour doesn’t plunge Corbyn and he gets a Commons majority, even with the fascist FPTP rigged voting system, they’ll have to split the partei to stop him. Sad rally, he’s further to the right than Richard Nixon.
This is a) boring in its use or abuse of English b) rather close to diatribe
Ah! But the difference is who benefits from Tory spending.
Tories always make sure that the money goes to the people who ‘Know the value of it’.
Heaven forfend they let the poor get their hands on any of it.
The Conservative government practice the art of illusion through the medium of main stream media. The electorate who keep voting them back in, seem captivated by the show.
Your conclusion from this analysis needs to be shared!
Absolutely, it is truly disgusting how unpatriotic the right wing press really is, they have done untold damage to our country by perpetuating the myth that the Tory party is the only party who can be trusted with the economy. They need to be called out at every opportunity for the lying lobbyists they really are.
Sorry, rant over now, keep up the good work Richard.
Desp
It’s hardly a surprise: higher taxes and spending under Labour will always result in a lower deficit, as transactions increase in size and frequency, people feel they can spend freely as opposed to needing to save, and more money is returned to the Exchequer as a result.
The fact that Tories reduce taxes and spending, and encourage offshore saving, thereby increasing the deficit, wouldn’t even matter so much if they didn’t also pretend to care about how terrible the increases in the national debt and deficits were, and use inappropriate household narratives as a disingenuous and hugely damaging excuse to reduce essential spending.
(Whilst at the same time owning the private sector savings that benefit from the yields and NS&I bonds!)
Which goes to show its also about hurting the poor, not just about squirrelling away money.
As Gore Vidal said, “It’s not enough to succeed; others must fail”.
This describes Tories, to a “T”.
Agreed
Just to make this clear in my head because it worrying when you listen to the news and there seems to be absolutely no understanding of this. But there is very little reason why the Government needs to run a surplus and that the national debt will never be ‘repaid’ and all we can really do is just reduce the national debt as % of GDP. So the sign of a good government is one which which grows the economy without growing the debt as fast, but every government essentially borrows. I just find it a little scary when you watch the likes of Andrew Marr press Labour MPs with ‘when will you get rid of the deficit?’ because the reality of it is, we don’t need to until we have a growing economy and even then we might not get rid of it entirely.
You are right: not only do we not need to get rid of either the deficit or debt (they are not the same) but doing so would be deeply economically harmful a) because the debt is needed for pensions and bank funding and b) the deficit is essential economic stimulus right now when the private sector is doing nothing of substance
I find the information very interesting, although not at all surprising tbh, but would have liked to have seen more emphasis on the fact that as the sole issuer of a fiat currency there is no “debt” involved for Government (nor can it go bankrupt and nor does it tax to fund spending) and that it is not the size of the debt that matters so much as how it is spent and the value to the economy.
It’s pretty damned clear that tax breaks for the ultra-rich and corporations has done pretty much nothing to spur any real business investment in the UK, and that the neoliberal insistence on flogging every last bit of our public resources has not proved either efficient, or cost effective!
It would be nice to see similar analysis of the standards of living in each of those periods of time as well, or the improvements in those – although that is often much more difficult to quantify.
I do my best on those other issues as well
One blog post can’t do everything
Apologies for being as dense as usual, Richard, but are you saying that the Conservatives have spent too much and that this spending has not been productive?
I am saying that they have borrowed more than Labour
And they claim the reverse
That’s it
Hi Richard,
Many thanks for this – very clear. I have shared on Facebook and await the expressions of dis-belief/outright denial.
One thing that I have frequently heard in response to this argument is the idea that Labour hand over deficits to conservative governments whereas Labour inherit better finances from conservative administrations. From your memory do you believe there is any merit in this argument?
If not, I could stop being lazy and look into it 🙂
Neil
As I noted I checked this out and lagging the data by two years to allow for this made no difference at all to the conclusions
Apologies Richard – in my haste I overlooked that in the notes at the end.
Slightly confused. You consistently say the deficit is irrelevant and the government should borrow more to stimulate the economy etc. You prove the tories borrow more than labour so are you actually saying we should vote Tory rather than labour if you look solely at this point?
Not at all: I showed Labour borrowed more pre crisis than the Tories but also repaid more
They repaid more because they stimulated more
Tories run desultory economies that can’t repay
But I’d argue now that Labour is not planning to borrow enough and Tory plans are utterly destructuve
Anth says:
November 27 2017 at 1:52 pm
2Slightly confused. You consistently say the deficit is irrelevant and the government should borrow more to stimulate the economy etc. You prove the tories borrow more than labour so are you actually saying we should vote Tory rather than labour if you look solely at this point?”
Anth, I think that depends on what you think borrowing is for. If it’s to support individuals getting ‘filthy rich’ and you are ‘very comfortable’ with that then the Tories are for you. Not that you will necessarily be allowed to get your own snout anywhere within sniffing distance of the trough. They will always imply that you will so you’ll vote for them.
If on the other hand you think public borrowing should support investment in the society you live, in a Labour vote would be more likely to achieve that end. (Though they won’t always get it right especially if the party is run by Blairite neoliberals with sharp elbows and long snouts)
I hope that helps to clarify your confusion. Ultimately you need to vote for a parliamentary candidate who will represent as closely as possible your interests in working towards a society you think might be fit to live in. Often that will involve voting for the ‘least worst’ candidate.
If you are impressed by numbers and I know a lot of people are, then the numbers above suggest that on average Labour is probably a better vote.
Sorry to clutter your blog with multiple comments…
The point I raise above will be such an instinctive reaction to your argument (I have seen that riposte many times in online discussions) that it might be worth (the next time you produce these figures) including a calculated example for it.
Or perhaps I am just trying to cover for my inability to read things to the end!
I did it last time
I will search it out
Call me picky, but I find it a bit peculiar for you to use the past tense in relation to analysis of data which includes 5 years of forecasts up to 2022. The central premise would be much stronger if you just used the historic data. (And of course it is not so much how much you borrow that matters, as what you do with it.)
For more historical perspective see:
* https://fullfact.org/economy/government-borrowing/
* https://fullfact.org/economy/labour-and-conservative-records-national-debt/
And I think they need to update this one again:
* https://fullfact.org/economy/deficit-down-two-thirds/
The answers would be the same
Picky Andrew says:
November 27 2017 at 3:34 pm
Call me picky, but ….:-)
It seems to me the the tories have privatised a lot more than labour have done as well, but I can’t remember ever seeing a post or analysis proving this. To have bigger borrowings while selling off the family silver would make this even worse.
Would it be possible to add in some info regarding that as well?
I have looked at it
It does not, to be honest change much
Nor does PFI
As it seems the Torres have sold off a lot of our countries assets then it do wonder where the income from these sales have been used. I am not qualified but I was a book keeper for some 25 years and started with accounting from using nominal and journal ledger to create and maintain companies books to ending up with sap accounting, a long journey. So if this was a company then to be in debt,selling assets, not maintaining repairs and renewals and no staff pay increases I would be wondering where in asset sales are being spent. May be this is to simplistic but we seen to be spending money in large projects and pledging large sums to third parties when we do not maintain our basic company assets and staff. Please help me to understand because if I was an auditor then I would be asking where the funds are going.
.
Great Article Richard, Thank you.
The Conservatives have always had an Augustinian tinge towards debt so it seems: “Lord make me pure, but not yet”.
Fantastic work yet again. Unbelievable that no-one else has attempted it. Frustrating that the now-anti-austerity Labour Party don’t lead with it. I know it’s difficult for them to speak with confidence because it takes a lot of effort to really understand the figures. But they will have to do it to put the stake through the neo-lib zombie.
To make it easier for them, especially on the Old Left, I’d put it like this:
It’s bloody obvious. You either tax the rich or you borrow from them. Since interest is a form of tax to use a privatised money system, it means:
You either tax the rich
Or the rich tax you.
What did you expect of the Tories?
@mikew,
“Frustrating that the now-anti-austerity Labour Party don’t lead with it.”
The danger with that is that it becomes a bragging match as to who can borrow less, or who can achieve a surplus. This is unhelpful because the amount of the deficit is simply a number with no real significance as to public policy. For Labour, it would be playing on away turf, and straight into the neoliberal narrative.
The government should aim for a growing economy and genuine full employment. The budget deficit to be whatever it is; simply an indicator. What it should *not* form is any kind of target for policy to be designed around.
Whilst I see the point you are making, I’m not sure I agree with your analysis.
Analogy : I rent a house. I enter into a contract to (say) an expensive broadband service. I then sublet to another person, but the contract is still payable. The sub-lessee will be stuck paying the bill, with interest until it is paid off.
Similarly the party in power has to pay the bill for any debts due which were incurred by the previous government – of whichever colour.
I am of the opinion that whichever party was in government at the time of the crash of 2008 would 1) not have foreseen what was happening, despite house prices having risen by ridiculously large amounts of 15 to 20 % PER ANNUM(!) 2) have relished the fact that – as Gordon Brown thought – cyclical boom/bust had been consigned to history, and 3) have been caught helpless and unable to fund the normal activities of running the country without incurring the eye-watering amounts that are now owed.
Let’s suppose you’re right
Why didn’t the Tories stop borrowing then?
Oh, and why if it was Labour’s fault did it happen worldwide?
Can you factor in the squandering of the oil income in the 80s by Thatcher? The sheer financial incompetence of Tory governments is quite staggering.
I’d love to do that
It could be modelled but I don’t have time
That’s a shame. When the lost income from non stimulus tax cuts, the sale of income and non income producing public assets and the direct and indirect costs to the public from the loss of these communal assets is counted, I’m guessing it would be pretty clear which side runs the economy and infrastructure down and which builds it up.
From a Scottish perspective that would be a very interesting exercise and I’m very keen to see the explosion of the myth that the Tories are the only party capable of managing the economy.
Our mainstream press up here are quick to remind us that we don’t have the financial means (or nous) to run our economy, so it would be useful to be able to demonstrate how destructive and costly the Tories’ profligacy with oil revenues has been for both the UK and, in particular, Scotland.
I really do not have the time
My next year is very pressing already
Ken Mathieson says:
November 27 2017 at 10:17 pm
“From a Scottish perspective that would be a very interesting exercise and I’m very keen to see the explosion of the myth that the Tories are the only party capable of managing the economy.”
People don’t vote Tory because of figures on charts, they vote Tory as an act of a quasi-rligious faith.
You cannot bust faith with ‘facts’ and statistics.
It is enough to see the evidence. When Tories are in government the poor get poorer. When a more left wing government prevails the rich do not become become poor but the poor don’t have to go to foodbanks and soup kitchens.
In Scotland, currently, it is the SNP who are providing a left wing alternative to neoliberal (paleo-conservative) policies and the Labour party are struggling for relevance. This may not always be the case because there are ebbs and flows in political currants (sic), but Conservatives are always the party of the wealthy: that is their entire raisin (sic) d’etre.
MSM does not accept that Scotland is on a different trajectory to rUK. For that reason, if for no other, MSM commentary of politics in Scotland generally misses the point.
Thatcherite squandering of oil revenues is history, like Bannockburn and Flodden Field. Best forgotten, but the lessons remembered. Perhaps we should stop celebrating the demise of Guy Fawkes and have bonfire-night in Scotland to celebrate the demise of the ‘Poll Tax’ and Thatcher’s belated fall from ‘grace’.
We cannot live in the past – the past is another country; they do things differently there. (as LP Hartley wisely observed)
This ma be an inside as I agree with you that the asset sell off should either be recorded as debt or if funds were paid to the treasury then effectly the borrowing should be less by the sales if not then the sales income was spent along with the debt so What on and where
https://www.economist.com/news/britain/21693968-sale-government-assets-can-hurt-public-finances-much-help-them-great-british
This may also help
https://www.gov.uk/government/news/government-creates-new-company-to-deliver-record-asset-sales-programme
https://www.gov.uk/government/uploads/system/uploads/attachment_data/file/629664/UK_Financial_Investments_Limited__UKFI__Annual_Report_and_Accounts_2016-Web_accessible.pdf
The data for oil and gas revenue (converted to 2016 prices) shows that Conservative governments benefited by £277 billion and Labour by £110 billion.
The data for privatizations is more problematic – and could really do with being taken back to original sources, but taking the figures from The Independent article quoted elsewhere on this thread would indicate that Conservative governments benefited/planned to benefit by approximately £180 billion and Labour by £6 billion. Not sure what adjustments should be made to account for the bank purchase/sales.
Stripping out the effect of both of these exceptional contributions from the borrowing totals (at 2016 prices) that you gave above would give:
Total borrowing Conservatives: £2,062 billion (£43 billion/year)
Total borrowing Labour: £900 billion (£32 billion/year)
Making the Conservative contribution look even worse!
Any links for sources?
I managed to find a good source for the oil revenue data:
https://www.gov.uk/government/uploads/system/uploads/attachment_data/file/637097/Table_11.11_June_2017.pdf
If anyone can suggest a similar source for government asset sales (I haven’t been able to find one) I might have a go at putting the numbers together.
The part that is probably too difficult to do is including the ongoing impact of the asset sales themselves on government expenses, e.g. increased housing benefit/MOD housing costs etc.
Hi Ken,
I agree that you don’t change people’s minds with facts and figures – that is best done by appealing to emotion, self-interest and wrapping things up in a compelling narrative and/or vision for the future.
However facts such as these are a useful foundation and protection when the inevitable attacks against “heretical thinking” arrive.
Neil
There was a link from the Independent earlier on this thread
Check the House of Commons Library too – I think they have done this
Neil says:
November 28 2017 at 10:22 am
“However facts such as these are a useful foundation and protection when the inevitable attacks against “heretical thinking” arrive.”
Can’t argue with that, Neil. As long as I’m not the one who has to crunch the numbers. 😉
[…] Cross-posted from Tax Research UK […]
A lot of work went into preparing this table, I imagine, but I reckon it’s been worth it. Myths need to be busted, don’t they? I’ll be sharing this post. Thank you.
Thanks
Richard, you say that factoring in revenue from privatisation wouldn’t make much difference. As of December 2015, I make it Tories c120 Bn, Labour c6 Bn. Looks like a lot to me .And they were expecting Osborne to do some more damage.Info from The Independent http://www.independent.co.uk/news/uk/politics/george-osborne-on-course-to-sell-off-more-public-assets-than-any-chancellor-for-more-than-30-years-a6786926.html
Tories may not have been in power up to crash, but we fully subscribed to Tory policies at the time.
Your data comes from?
Might you share?
Feel free to share. The data is from The Independent. Link in text. They have a nice graphic in there. Didn’t want to borrow it without permission.
How does the saying go? ‘The great thing about facts is they’re true, whether you believe them or not.’ Maybe the perpetrators of the Tory Financial Competence myth should take heed.
I presume that the conservatives borrow more in order to offset tax reductions.
Tory supporter came back with this when I shared it on Facebook:
“Nice to see he worked it out in every which way possible other than taking into consideration the fact labour were in charge during perhaps what was the biggest economic boom the world has ever seen. Which produced a considerable surplus for four years, at which point they decided to spend spend spend and put us in a decicit far quicker than necessary. Of course this will help swing the numbers in favour.
“Infact they probably did work out the figires taking those four years out, but decided not to as I’m sure it would have painted a very different picture!
I worked it out over a very long timer period so that booms and busts spread out
The view offered is absurd – the bigger booms were earlier and not around 2000
I’m sorry – but the comment is not in the slightest bit evidence based, unless asking to take out all good Labour years and leave in only bad ones is described as evidence these days
Could you please explain why the Conservative/LibDem coalition government borrowed £110bn in 2010?
Is it because they had an enormous victory party at the taxpayers’ expense?
Or is it because that borrowing, and indeed all the public sector borrowing made since 2010 should correctly be attributed to the £152bn deficit created by the previous Labour government?
I have explained: I have lagged the data for two years to see if thus changes the view and it does not
But whilst I am at it, why did Labour borrow so much? Was it because they ran a party or because there was a worldwide crash starting in the USA?
Sounds like a PMQ question (?) Rhetorical and pointless.
A 2 year lag doesn’t do it justice since even the initial over-ambitious target set by George Osborne would have meant it would have taken 5 years to bring the budget back into balance. Even after Tony Blair won for the first time in 1997, it took them 4 years to screw it up.
I wonder what happens to your figures if you stop the clock in 2010…
But more importantly even than that, let’s look at the present and the 2 most likely futures. One with a Conservative government continuing to work towards eliminating the deficit and reducing the debt to an altogether more palatable level. Or an alternative future with Labour’s plans to increase borrowing by a figure so enormous John McDonnell can’t bring himself to say it. It’s an additional trillion pounds in case you’re not sure. That’s a conservative (small c) estimate based on the election manifesto, the party conference speeches and interviews given by various members of the shadow cabinet around the budget.
I know which furure I think would be better for the country and it involves keeping self-confessed Marxists out of Downing Street.
If fifteen years is not enough two will do just fine
The you reveal your lack of objectivity
I tried to present that quality so please do nit after my time
I’ve just checked the Ministry of Truth, aka the BBC. Nothing. Maybe it’s on the Ministry of Love? or as it’s more colloquially known, The Daily Heil. Ah, something about a bearded guy and his girlfriend, a story that’s going to torture us for the next few months – otherwise nothing.
Still, I have a dream, that one day a politician will stand up tell us something close to the truth: why we need to borrow, why we need deficits, why we need a wealth tax, why we don’t need Trident or nuclear power stations, and not things like: “We need to nationalise Scottish Water”. (Richard Leonard, who although an MSP has his speeches written in London, it would seem)
G Hewitt,
“Ah, something about a bearded guy and his girlfriend, a story that’s going to torture us for the next few months ”
Is that the one that goes:
“Actress announces engagement to former soldier”?
@Andy Crow You’re not going to get that Grauniad column using words like “actress”. (smiley thingy)
This issue could be a good research project for an Economics/Statistics postgrad as it raises a lot of questions. For example, are these differences in borrowing statistically significant; what proportion of GDP do they represent; what was the borrowing for – investment or current expenditure; relationships to wages at all levels, to unemployment; effect on asset prices, housing, stock market; what about the IMF bailout in 1976 following what the FT says were decades of use of IMF funds???
I may have students on this issue next term….
[…] http://www.taxresearch.org.uk/Blog/2017/11/27/the-tories-created-two-thirds-of-the-uks-national-debt… […]
[…] http://www.taxresearch.org.uk/Blog/2017/11/27/the-tories-created-two-thirds-of-the-uks-national-debt… […]