The personal tax statement announced by the government yesterday continued to bug me last night, so I did some more analysis.
First I used data on the break down of benefits payments tweeted by Jonathan Portes and apparently from this web site - although I admit I can't see it there. It looks reliable, although I had to allow for rounding (which is fair).
Then I assumed a number of quite reasonable things, all based on the fact that although there were explicit spends in 2013/14 of £726 billion there are additionally what are called tax spends, which are money not collected as a result of reliefs and allowances within the tax system, and there are also some implicit subsidies the government supplies not even included within those totals.
Of the latter I included just one, which was the mid point of the annual cost of implicit subsidies supplied by the government to the banking sector which the IMF estimates as being in a range from $20bn to $110bn a year and which I took to be $65bn or £41bn.
Then I used HMRC data on the costs of allowances and reliefs excluding pensions, which I took from the HMRC estimate here. I included a range of these allowances and reliefs. So, personal allowances for income tax and NI are in the list as they are provided as of right to anyone who qualifies, just as benefits should be, and so are completely analogous with them.
Then I looked at all tax reliefs for savings and investments of various sorts from ISAs, to capital gains tax allowances through to enterprise incentive schemes. These are all reliefs for those with investment income. This is an explicit subsidy to some people that seemed directly comparable with many benefits payments in that sense (alone, I stress), so they were included to.
After that I also looked at VAT exemptions on spending that is largely by those well off, which was that relating to private education and health. I could have included UK domestic transport too as much of this is a subsidy to commuters but decided not to: these things are, eventually subjective.
I also included capital gains tax relief on housing as a specific category since this is as much a subsidy for housing as is housing benefit.
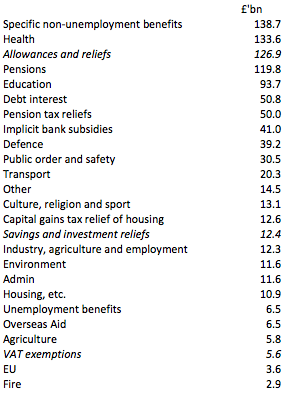
The overall workings are here: I won't reproduce them in this blog as they clutter things.
Then I reduced the data by categorising it to ease presentation, which included grouping all non-unemployment related benefits, all savings reliefs, tax and NIC allowances and VAT exemptions as the results would have been unreadable and not useful otherwise.
And then I turned it all into this pie chart (click on it for a bigger version):
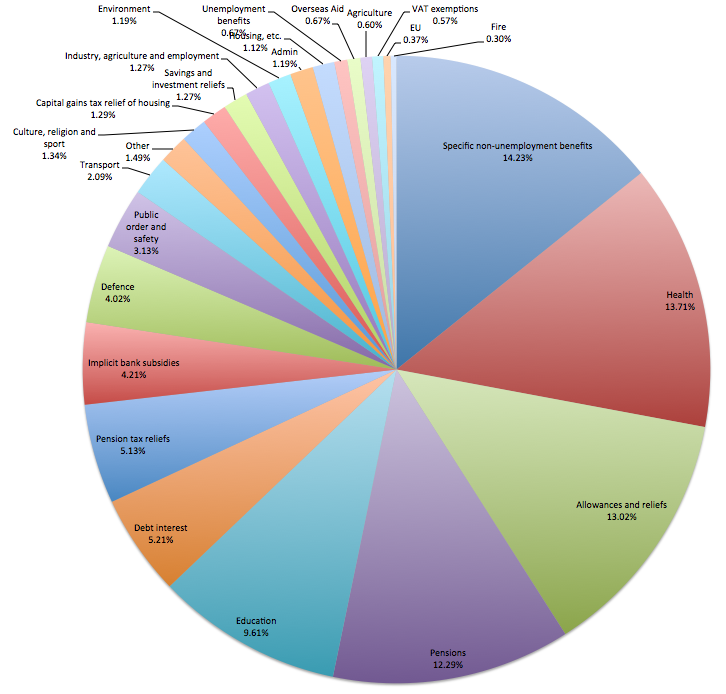
This looks very different from the impression George Osborne wants to give. The third largest category of spending is now allowances and reliefs from which everyone benefits (even the highest paid via national insurance) whilst the seventh largest category of UK spending is pension tax relief and the eighth is implicit subsidies to banks. The data is here.
Add together the cost of subsidies to banks, the subsidy to pensions and the subsidy to savings (call them together the subsidy to the City of London) and they cost £103.4bn a year - more than the cost of education in the UK.
There are other absurdities that also become apparent. For example, unemployment benefits cost only half the amount used to subsidies personal savings and investments.
It's also no wonder house prices are so distorted when the implicit tax subsidy for home ownership is £12.6 billion a year.
This is the statement George Osborne would not want you to see because it makes clear that subsidies, allowances and reliefs extend right across the UK economy. And they do not, by any means, appear to go to those who necessarily need them most. The view he has presented on this issue has been partial, to say the least, and frankly deeply misleading at best.
I do not mind having a debate about tax. I relish such things. But it has to reflect facts. This data much better reflects those facts. And I did not even include tax lost in this data. The cost of cheating makes things look even stranger still:
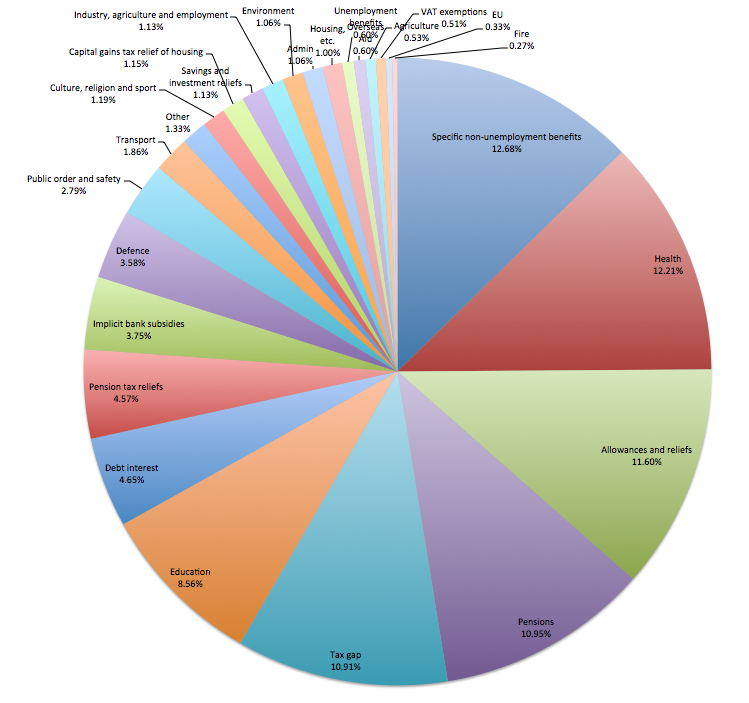
The tax gap of £119.4 billion comes in at a cost almost identical to pensions, to put it in perspective.
I leave you to decide which one to choose, but whatever it is, George Osborne's version is wrong.
Thanks for reading this post.
You can share this post on social media of your choice by clicking these icons:
There are links to this blog's glossary in the above post that explain technical terms used in it. Follow them for more explanations.
You can subscribe to this blog's daily email here.
And if you would like to support this blog you can, here:

 Buy me a coffee!

A very interesting breakdown! It would be interesting to hear Mr Osborne comment on this… actually I can imagine the remarks made over breakfast.
I have a tangential comment, where you wrote:
>I could have included UK domestic transport too as much of this is a subsidy to commuters but decided not to: these things are, eventually subjective.
How wide would your inclusion of UK domestic transport have been – the standard subsidies of rail, or the subsidy of roads too? As someone who drives under 10000 miles a year I get annoyed we all pay the same regardless of the wear & tear we cause to the roads, and often discussions only focus on railway transport costs, which I can never understand.
Even if you personally drive less than 10000 miles a year doesn’t mean that you’re not responsible for some of the other traffic on the roads and it’s corresponding wear & tear.
You’re also not paying the same as other road users – some of the funding comes from fuel duty & VED varies by engine size, fuel type & CO2 emissions.
It’s worth pointing out that any road use that Peter is indirectly responsible for (e.g. haulage of food and other goods) will invariably be factored into some cost he pays somewhere down the line. So I don’t think that that’s particularly valid point.
It is true to say that the state extracts vehicle related taxes in a variety of ways (namely VED and fuel duty) even if there isn’t a direct relationship (road’s are maintained at county council level last time I checked, and there’s no hypothetical of VED or fuel duty). I do think however that Peter raises a valid point vis a vis wear and tear.
I think the optimal system would be to recoup the wider costs (externalities) of fuel consumption (i.e. climate change, poor urban air quality, etc) through fuel duty and VED but also recoup to the costs of road infrastructure (building and maintenance) through a genuine road tax. Not to burden the motorist further still you understand, the aim would be to spread the present tax burden more effectively and fairly. Personally I like the road pricing scheme implemented a few years ago in Singapore, wherein road prices were adjusted dynamically as a means of controlling congestion (which itself has an associated cost to the economy). They used a series of gates and a satnav style meter/road price map, but with GPS, GLOSNASS and the upcoming Galileo satellite navigation systems at our disposal I doubt we’d need such for a similar road pricing scheme here in the UK.
Furthermore, as far as I’m aware ‘zero-emmission’ vehicles are zero rated for VED and they clearly don’t pay fuel duty (at least not at the pumps). Yet they do still contribute to CO2 emissions (electric vehicles are only as ‘green’ as our national grid). to wear and tear of our road infrastructure, and of course still take up space on our roads. How will we make up the funding shortfalls arising from wide scale adoption of zero or low emission cars? We can’t expect a dwindling number of relatively high-emmission vehicle owners (amongst the poorest?) to carry the costs of our road infrastructure can we. It seems clear that given the inevitable changes in vehicular technology our current model of vehicle taxation, premised on the notion that fuel use scales with road use, are rapidly becoming outmoded and that a new system which attempts to more directly attributes costs of road wear, tear and usage will be necessary, eventually. No?
Almost certainly, yes
But the whole idea of how we manage transport will have to eventually become post carbon
I do not pretend I know answers
So by adding many things that are in no way spending the spending pie chart changes fundamentally.
Who would have expected that?
They are technically called tax spends
How are they not spending?
Richard, seems to me these “tax spends” in the form of tax foregone are very similar to the opportunity costs of potential profit foregone by a business adopting a certain strategy – factors that are built into every decent business plan, and which are treated as valid costs in calculating the cost-benefit analysis of the plan.
The impact of a tax spend is identical to government spending because in both cases the person ends up with more in their pockets As a result of a deliberate government decision. They are, therefore, directly comparable.
“They are technically called tax spends
How are they not spending?”
I could earn more money if I changed job, or chose to work longer hours, or went for a promotion internally.
I don’t want to do any of those things because I am satisfied in my current role.
The idea that this income foregone is part of my “spend” is nonsensical.
Similarly, the government does not tax everything consistently: it wants to encourage this, it wants to encourage that etc. By including some of the things that you have, by taking them to their logical extremes you could end up with a pie chart that is quite absurd.
This is a perfectly acceptable and sound way of looking at tax
Just a question, but the subsequent subsidies to the City of London, do they fall in-line as a percentage of the Tax spends of other western countries when their primary export is around 70-80% of it’s Gross Domestic, because I am struggling to be surprised by that figure??
First, why subsidise profitable business?
Second, this is a subsidy to export harmful and not beneficial activity
Third, this is a subsidy that is not needed: these institutions could raise their own capital
to subsidise lending for start up businesses, to grow the economy.
but you still didn’t answer my question:
do they fall in-line as a percentage of the Tax spends of other western countries when their primary export is around 70-80% of it’s Gross Domestic?
No idea right now and I am now in a hospital bed
Because they’re tax income foregone
Superb, Richard. And one thing we can be assured of – your methodology is no less “subjective” or questionable than Osborne’s, so cannot be attacked on those grounds. And what insightful pie charts they produce. Certainly what the government doesn’t want the public to see.
On which point, I’m assuming you’ve alerted C4 News (Paul Mason), The Guardian, BBC, FT, and so on? And I’m assuming various unions will pick it up and use it. What about Labour? The relevant shadow ministers, and Miliband of course, must have this to hand over the coming days and months. It totally debunks the divisive and dangerous mythology the Tories and their supporters in the media continue to manufacture.
I’m tempted to say that it could (should) also provide Labour with the ammunition to try to start a new ‘stop persecuting the poor’ narrative (as opposed to the rather tired and silly sounding ‘squeezed middle’) – but then I realised we are talking about the ‘neither left nor right’ (i.e. no politics) party of Jim Murphy.
Anyway, thanks for the work on this. I’ll certainly make use of it.
It has begun to travel
Thanks
It’s certainly no less accurate or relevant than Osborne’s attempt at pushing a marketing line.
But both still perpetuate the myth that government spending is somehow linked directly to taxation, when the reality is that taxation has a completely different purpose.
Something I think you pointed out the other day – an echo of what Beardsley Ruml pointed out in 1946: stabilise purchasing power, correct the income/wealth distribution, correct externalities and hypothecate to highlight certain spending.
I agree that is the case
But actually – you’ll note I have no actually linked these charts to income: they are pure spend analysis
I could assume you could mark the percentage of deficit outside of the labels on the chart?
You could – but I have not tried
Nor am I sure I am that clever
The problem is in the name ‘personal tax statement’ in the title. Just those three words show the ‘accounting policy’ that the government wishes to apply to the figures.
It might be useful to add and estimate of how much the spend is short/tax is too high to maintain full employment.
After all if accounting can predict pension shortfalls in corporates, surely it can dream up a number that would get us to full employment. 😉
Here’s the Ruml reference from Wiki:
“In 1945, Ruml made a famous speech to the ABA, asserting that since the end of the gold standard, “Taxes for Revenue are Obsolete”. The real purposes of taxes were: to “stabilize the purchasing power of the dollar”, to “express public policy in the distribution of wealth and of income”, “in subsidizing or in penalizing various industries and economic groups” and to “isolate and assess directly the costs of certain national benefits, such as highways and social security”. This is seen as a forerunner of functional finance or chartalism.”
This is something that Abe Lincoln understood. Time for your new book, Richard!
Indeed
Not referred to directly as such, but very much dealt with, I assure you
Hmm. The £126 bn tax and NI allowances are the equivalent of nil rate bands, I can’t see any justification for including those any more than saying basic rate income should have been taxed at higher rate, so the difference is spending. If you are going to include reliefs on pensions then you also need to knock off the £12 bn of tax paid on pension payments, as the source you link to does.
ISAs etc are again arguably a nil rate band for those who bother to get their investments into the right wrapper. Though it is even more arguable, I’d say the main residence exemption for CGT is still more or less a nil rate band for CGT on a specific asset, and in any case you have to allow for the IHT that is eventually paid on these properties (not a lot, indeed not enough, I agree).
There’s a better argument for some of what’s left, particularly VCTs and RIS which can be seen as an alternative to state subsidies. But the big ones, which most skew the figures, don’t seem to me to be properly analogous to government spending, regardless of the designation “tax spends”.
Sorry Mike, but you are just wrong
If a benefit is a right intended to put money in a person’s pocket in a specific situation so are these exactly the same thing
Arguing otherwise makes no sense
Thanks for this analysis Richard. Here is the non-paywall link to Liam Halligan’s article that mentions implicit UK bank subsidies of $110billion. http://www.telegraph.co.uk/finance/comment/10822521/Only-full-separation-will-make-our-big-banks-safe.html
Thanks
I cautiously took the IMF range mid point
Where are public sector pensions on your chart? Am I right in thinking that a lot of the criticism was that Osborne had included them in welfare? I am not sure whether that was pensions to which contributions had explicitly been made (NHS?) as well as those where contributions were implicit like the civil service where pay systems reduce pay to acknowledge the pension rights.
Now in pensions
Isn’t it ridiculously misleading to make a difference between a spending an allowance. Allowances are inherently arbitrary and factored in to the original tax itself.
Why not designate the “actual VAT rate” 90% then cost in a “72.5%” allowance.
That would make the new hypothetical ‘VAT rate allowance’ cost hundreds of millions of £s.
Farcical? Yes. But no more than the allowances you have picked.
The only person who looks silly here is you
I am looking at the system as it is
You are just making nonsense up
“I am looking at the system as it is”
But with respect you are not. As Philip says, allowances are factored in to the tax rate. You cannot logically argue that they are part of some “tax spend” without arguing simultaneously arguing that any difference between a given rate of tax and 100% is also a “tax spend”.
Respectfully, please talk nonsense elsewhere
This is excellent work. I was so incensed by what Osborne has done that I started a petition against it, which may be signed at http://chn.ge/1x0gjPN
I also wrote an article on Vox Political, which is here: http://voxpoliticalonline.com/2014/11/04/sign-our-petition-to-kill-osbornes-tax-statement-propaganda-sheet/
I’ll do another, linking to this piece, as soon as I get the opportunity.
Thanks
Seems rather subjective but let’s run with it for a moment. What comprises that 12.68% non-unemployment figure?
What would be the effect overall of raising the minimum wage to an indexed Living Wage simultaneously scrapping all in-work benefits?? housing allowances etc included, transferring the burden rightfully to Stockholders but allowing for the raised costs of many public servants.
Also in the Pension category of 10.95% what would be saved by capping all existing public sector pension payouts at the Living Wage level, given those people paid into an effectively bankrupt scheme? and only the more overpaid civil servants will be exceeding the LW figure anyway. Is that data available.
The break down is in the data links
Living wage would help but will never cover child benefits, some rental needs, durability benefits and much more
There are no simple solutions to benefits because we are complicated people and we should be proud to pay when there is need to be met, in my opinion, because that’s what good societies do
Thanks for this Richard.
Are energy subsidies included in your analysis?
There was a previous Environmental Audit Committee report on these and I understand they are quite substantial.
See http://www.parliament.uk/business/committees/committees-a-z/commons-select/environmental-audit-committee/news/publication-of-energy-subsidies-report/
Would be interested to know if picked up already in one of your categories.
Thanks
James
Sorry – did not cover that one explicitly
I’ve listened to radio 4 for 40 of my 55 years… politicians are politicians – they put on a show and then recess to the bar where they have a good laugh about whatever… It’s those OUTSIDE the club who suffer and, guess what, most of us are.
IF those who represent us can do the following what is a little whitewash over such a minor matter at this issue to them?
ttp://www.reprieve.org.uk/press/2014_10_30_Court_of_Appeal_Belhadj_Libya/
It is obvious what George Osborne is saying to voters with his tax statement stunt:
”Pssst, look at your lazy neighbours. Those single mums and unemployed lot get free stff which you have to pay for. Vote Tory and we’ll punish them for you because you’re a hard working family.”
A cheap, nasty trick.
i notice you include entrepreneur cap gains as a benefit as it is a lower rate of capital gain tax. If you follow that logic surely you should assert the income tax rate as being 45% and include the lower two bands in your “benefits” calculations?
No: because that CGT rate is targeted relief aimed at a specific economic situation, not a universal rate
Ok, but how is it targeted at a specific economic situation, it doesn’t have a time based expiry, it is part of general taxation policy now, just like higher rate income tax. Or do you mean that it is targeted at people in specific tax circumstances, which means it is again, just like higher rate tax payers? And if that’s the case, should you then not net out the additional tax paid by 40% and 45% payers, as that is a “non-benefit”?
It is targeted to promote a specific form of behaviour and is a relief only available to those who do it
Why is that so hard to understand?
Promote a specific sort of behaviour, that being to encourage start-up small businesses with employee based shareholders? Is that something you wouldn’t want to see encouraged then?
The tax relief rarely is ever works like that
Really, what source are you using for that comment? My personal experience as an employee of such a firm is that it worked exactly like that.
My experience
There are exceptions to every rule
I also happen to think they do not work – again, based on experience
So you are against a Labour Party policy implemented by G Brown based on your own personal experience rather than a wider source, that’s fair enough! But stating that you have an issue because some of the entrepreneurs who sell out never work again, well that sounds a little bit like politics of envy! Surely we all want an economy to be successful don’t we?
As a person who has been an entrepreneur – several times – I full understand what makes entrepreneurs tick
Tax is not one of them
And envy is something I know nothing about – but I presume you do
Nope sorry that doesn’t work – Allowances and relief’s as one example is not real money – it is the income you are allowed without paying tax on it – but that assumes that we all work for the government – not the other way around.
Start from the position that ALL the money we earn is ours to do with as we please and that we then make a contribution (with assumed consent by voting a government in) to community costs – so Allowances and Reliefs are not a cost to the Country at all.
Government on the other hand is.
Being pedantic as to the breakdown of state supported benefits is also a misnomer – if an amount of money is paid from our taxes to individuals in need of support – for whatever reason that is part of the welfare safety net (which makes us a civilised society) it doesn’t need breaking down further to try to make it look less – it is what it is.
Pensions are not part of the Welfare State, only if the pension received is paid to someone who has never paid tax and haven’t had, at any time, relatives who have paid tax, is a social benefit – it is simply a legally due repayment from a state wide savings plan – so is also not technically a cost to the country (if you hadn’t been alive to pay into it you wouldn’t bed around to draw out of it)
There is a lot wrong with this breakdown – but then there is a lot wrong with the system – why muddy the waters arguing about the detail – changing the system and its transparency – and the emphasis on who works for who, is the only sensible use of time.
Your starting point is very obviously wrong
All money you earn is not yours unless you are specifying money after tax – that is yours, but the tax is glaringly obviously not
You’re legally and factually wrong – and al that follows is the same as a result. Arguing on the basis of a myth can only create a mythical outcome
That response is proving exactly what I was saying about who works for who.
(Try working on this – if you are paid by the Government directly or indirectly to perform work on behalf of the state – why are you taxed at all? That should be another concept that doesn’t compute?)
You seem to be stuck – as with most of our current politicians – in a rut that cannot see or perform laterally. Until politicians and bean counters and statisticians can think outside the box, frankly we are stuck with he said / she said arguments that take us exactly no where and improve nothing.
You’re taxed to make things equal – no tax system would work if you were not
Unless you’re willing to engage with the possible there is no debate to be had
As for thinking outside the box…most would say there are few accountants who can do that better than me
But you can disagree. That’s your right
Richard
It is legally and factually wrong to state that all income pre-tax is not that of the person who earnt it – legally it is. The tax system operates such that a liability arises to HMRC equal to the amount owed – they become an unsecured creditor to the person owing the tax until that liability is satisfied. This is why when a person or a company becomes insolvent, HMRC is not able simply to reach in and take the money owed to it – as it would be able to if it had a proprietary right in that money, such as a charge over it. Instead, it becomes an unsecured creditor like anyone else who is owed money by that person (s. 251 Enterprise Act 2002). I am grateful that our legal system reflects the reality understood by the great majority of people in this country rather than the inverted reality you appear to inhabit.
The law does not always explain social constructs and political and economic realities
Your reliance upon it shows you ignore such things
(Try working on this — if you are paid by the Government directly or indirectly to perform work on behalf of the state — why are you taxed at all? That should be another concept that doesn’t compute?)
I think that is a valid question. I believe, eg. the NHS does not pay VAT itself, as it is funded by the state.
VAT is refunded to the NHS as t is to many businesses
Not sure if you have seen it, but the House of Commons Library spends some time breaking down the 24.5% “welfare” block here – http://commonslibraryblog.com/2014/11/04/hmrcs-new-annual-tax-summary-whats-in-welfare/
Indeed….
Brilliant, Richard, many thanks. I may be missing something, but is tax relief on interest payments on debt in the financial sector included somewhere?
Not in there….would be reflected in reduced corporation tax
But it could have been shown as a spend, it’s true….
Nothing unexpected,
propping up banks essential to getting money to the people rather than face a catastrophic failure of the banking system which is the alternative, they print money and buy their own bonds at a level that the market will accept, mostly but not limited to the middle eastern sovereign wealth funds who also buy them as they consider the yield is fair given the risk of reneg, non payment and ability to pay interest and capital.
IMF asked Government to do something to get economy going so £12B for housing is in form of social housing subs and new guarantee liability for help to buy which has increased jobs by way of construction sector without which we would be in same boat as mainland Europe, facing deflationary pressure.
Ultimately the bottom line is that all parties need to face facts that this expenditure is not matched by tax receipts and some really big things are going to have to be reduced including NHS/ Benefits/ and government interference in economy (Bank subs & Housing Subs). God help us all, its going to be painfully even possibly messy.
Completely untrue: we are doing rather well without a balanced budget and there is absolutely no need for one
The only myth is that I and others are wrong on this issue
Richard, I am glad we have people like you in the world; thanks for this report and keep up the good work!
In addition to all that has been said/discussed here, there’s one question that I have.
The cost of the Work Programme. As this is a significant cost to the tax payer I think it should be reflected in your calculations somewhere. If you’ve included this significant cost in your workings, could you please tell us where, or if not could you include it please?
Thanks
Matthew
It’s impossible to cover all angles in these things
Sorry….
I appreciate that, but the tax payer should be made aware of how little bang they are getting for their buck in terms of the failure that is the work programme – a huge pot of tax payers money is going to private businesses as a reward for making life more difficult for the unemployed.
This thing has cost us billions and has failed to provide. I am surprised that it has been missed from your calculations – it is very significant, pertinent, relevant to your report, IMO.
I accept the point – remember this was written in an hour or two early yesterday morning
“we are doing rather well without a balanced budget”
Never thought I’d you hear you praise the coalition’s economic record, Richard!
I’m not
They think we have a problem with an unbalanced budget and I am saying that is not the issue
It’s their failure to spend that is
Great work and well timed as a quick response.
Have you had a chance to look at the cost of benefits going to those on very low pay?
One of the things that really bugs me is that it feels as if in-work benefits such as tax credits and housing benefits are in fact a subsidy to low pay employers allowing them to pay below the living wage and have the tax payer fill the gap.
The cost to the tax payer is huge and we end up blaming the claimant who may be working a 40 hour week not the employer.
I regret I cannot refine this further right now
I am in hospital and out of action for a while from Friday
Get well soon 🙂
Thanks
Thank you for such a well informed explanation of the possible truths and awful cover ups of George Osbourne’s Personal Tax Statement, i understand that not all issues have been included, but what you have achieved in just a few hours, is nothing short of amazing and eye opening.
All the best and get well soon.
Jay S Heathfield
Are there any plans to post the pie-chart-generator spreadsheet online? Recipients of the counterfeit Osborne version could just paste in the figure from the middle and calculate the proper numbers from that.
I gave posted all the data – just folle the links to it
I’m too thick to debate the details but not so thick as to fail to see that the chart is a better one than Osbourne’s nasty disinformation campaign.
This chart needs to be widely disseminated but even the larger version is woefully small and low-res. Please someone make a version large enough to be made into a print poster.
It has been read more than 40,000 times in less than two days
This Govt has spent considerable effort in moulding its definition of “Welfare”.
Its new “Welfare Trends Reports (WTR)” being a periodical first published in 2014, brought to us by the Office of Budget Responsibility — really. [1]
WTR announces, “This is our first Welfare trends report (WTR), a new annual publication that will examine trends in spending on different elements of the welfare system.” The OBR in defining welfare spending say on p11 “The term ‘welfare’ means different things to different people”. A long read at 189 pages it does reveal the Govt’s stance on defining Welfare; unlike the BBC’s brief report on 4th Nov [2] trying to explain Osborne’s personal tax statement. WTR’s similarity of title to the ONS “Social Trends” being no coincidence, conferring respectability.
WTR is a comprehensive read, containing much information. Chart 4.2 in WTR – Welfare spending by type of benefit 1983 to 2018 – shows a vanishingly small benefit of Jobseeker’s Allowance, as highlighted in Richard’s blog and also buried elsewhere e.g. the commons blog [3]. Richard’s disassembly of “Osborne’s Letter to the Nation” is of great service — where is Labour – in need of adult supervision ☺.
Where is the peer review in this periodical (WTR) of our nation. For example, OBR in classing Education in welfare spending confuses the needs and rights of the Individual, Society and Industry. Can a modern Society with Industry survive without a [welfare] educated workforce; who are the beneficiaries of education? Who will develop and fix the things we need — can the financiers and wealth creators with their computers achieve this, who do not appear to have assistance from the public ‘welfare’ purse?
[1] http://budgetresponsibility.org.uk/wordpress/docs/Welfare_trends_report_2014_dn2B.pdf
[2] http://www.bbc.co.uk/news/business-29898083
[3] http://commonslibraryblog.com/2014/11/04/hmrcs-new-annual-tax-summary-whats-in-welfare/
That sounds like I should take a look at that
Hospital reading…
Hope it goes well and sorts you out – we ‘older’ folk need an occasional visit to the workshop for repairs.
This is my first ‘service’ ever
Not bad after 56 years, I guess
Thanks
Oh my word my head hurts… I’m discalculate but understand the basics that you’ve highlighted… Could you (or anyone) present a SIMPLE pie chart that actually shows the injustices, or rather, highlight the differences between the subsides given to banks et al vurses the underclass?
Hope you get well Richard.
ps… This will look great on a t-shirt… 😉
“Respectfully,
please talk nonsense
elsewhere”
Sorry…mo time today and out of action tomorrow
If you’ve avoided having your tonsils out, appendix removed, and broken bones on the way to your “first service”then you truly have done well, Richard. And may it long continue after this service.
Incidentally – and I’m sure you’ve seen it anyway – Seamus Milne has an excellent piece in The Guardian today: http://www.theguardian.com/commentisfree/2014/nov/06/centre-austerity-britain-europe-ireland-spain-eu
No doubt it will be dismissed as nonsense by the rudderless ship formerly known as the Labour Party.
And of course there’s the headline article on Luxembourg – which any reader of this blog and related material will have been well aware of long before now. We shouldn’t forget the fact that the man in charge of this institutionalised piracy and pillage is now the president of the EU. ‘Trebles all round”, as Private Eye would say.
Anyway, all the best for tomorrow and a swift recovery.
I have missed all them; yes, so far I’ve been lucky
I tweeted Seamus – agreed, it as good
Juncker worries me….
And it will be trebles after tomorrow is done
Please kindly change the presentation mode, see http://www.businessinsider.com/pie-charts-are-the-worst-2013-6 for details. Also would be useful to have the official version overlaid to allow full comparison.
50,000 have read that blog
You say I got it wrong?
I don’t think so
Just out of interest, what’s the record for number of reads, Richard? 50,000 seems pretty good going to me, though I have to say I’m not that surprised. I don’t think there are many people – apart from the hordes of neoliberal zealots who are attracted to our shores (immigrants, many of them, I note) – that would include some public service pensions (but not others) as ‘welfare’, not even in the land of neoliberal zealotry across the Atlantic.
That is about 8 times the normal daily read
And way out a record for any one blog
The next was one on the NHS – which was read for months after I wrote it
Just wondering why agriculture appears twice?
Apologies: it should have come out of the combined heading where the government originally dumped it
Quick question, put to me by a Vox Political reader:
Why is Agriculture mentioned twice in your revised pie chart – once in ‘Industry, Agriculture and Employment’ and once on its own?
Apologies: should have taken it out of the combined heading
Then I’m glad to have flagged it up for you. Thanks for clearing it up.
Just like wearing clothes, one can appear different with the same gross/net result.
That being the case could you say Richard Murphy what your thoughts are on uk public spending co uk website ?
Sorry – no time to review
And I am in hospital tomorrow
A very interesting read, thank you. One minor disagreement in handling – I’ve always considered pension tax relief to be “deferred income” under the current rules – when it is accessed it is taxed at the usual rate. Treating it as an allowance strikes me as double counting. If you were to calculate the notional difference between the avoided tax rate on the way in vs the usually lower rate paid on the way out plus the Gordon Brown “dividend taxes” (which reduced the return significantly) pro-rata’ed to the relief portion, I suspect that is the actual benefit.
For most people who are not ultra-rich, this is a behavioural incentive to save, rather than spend it now. It will be interesting to see whether the justifiability changes with the new early withdrawal rules. I also suspect that early withdrawal will be seen to be a disaster – a quick cash injection now, then years of being much poorer, which will likely mean being eligible for more support.
Economically I disagree on pensions – a long story….
I am temperamentally disposed towards a universal income, but short of universal abundance, people need and want to build up assets to reflect their accustomed level of economic comfort. Pensions are an incentivised form of that, and have most value to those who don’t have easily re-allocatable income. The higher up the income scale you get, the more the incentive become merely tax avoidance, and in the absence of a complete replacement system, I despair of the tokenism of looking at the special arrangements applying to a few extremely rich people to suck yet more tax out from the merely middle class/income – particularly while MPs have hugely beneficial arrangements that are illegal and unavailable for anyone else.
This is interesting. I’m not uneducated but I’m no accountant or economist. I look at this more generally as exposing the ongoing attempts to hide where the real loss to our wealth has gone (i.e. into the cashbooks of the fat cats of the City – whose speculation went pear shaped massively but without any consequence for them).
We should not allow the naked truth that was obvious to all when the crisis broke to be hidden and twisted into a narrative that blames the victims of their crisis for the money that is being stolen from our pockets to (more than) prop up the City high-flyers (the capitalist class).
On a technical point there is no specific figure for Local Government. Am I right to assume this has being spread under the spend areas such as Education and Social Protection?
Your last assumption is right
Remember much social care is local authority work and few realise it
Just one thing – “debt interest”, how much of that is actually bank/life insurance company subsidy, given that we have a sovereign currency?
Presumably the sterling debt could be paid off via a QE type mechanism, leaving only external debt as a liability?
This is all gov’t debt irrespective of recipient
Yes – much if it could be written off – but not usefully
QE would be better used to fund new investment and jobs
With apologies, I have another question from a reader, who asks where payments to the private companies running WCAs and Workfare programmes are listed.
That will be in the relevant welare and benefits sections, I am afraid
Okay; a bit harder to work out, then. Thanks again.
Thank you for your artical, and for the laughs you gave me to you short swift responses to poeple who tried to suffocate this post with what I perceived as tory dross.
I have for some time felt our politicos have waxed lyrical of their respective views when in all they represent only a proportion of the average voter numbers, around 36%. So the governments under 50% of votes that got them into power really represents 50% of a 36% turnout, so infact less than 18% of all those elegable to vote, and this gives an overwhelming mandate for the imposition of austerity. Our system has been corupted for many years by people and organisations as the right wing has kept pumping the same arguement that its not you its them the scroungers, that this statement is now seen as truth and underwrites policy decision’s.
For a 2 hour exercise of your brain I doff my hat and as to the numbers of views you have really hit a cord, good luck in hospital and get back doing more of this. You have made a grumpy left wing old fart very happy.
Really interesting analysis. My only criticism is in the presentation of data. This could be made much more powerful by adjusting the colours to highlight the points you’re making.
Excel does not automatically produce clear data representations. I had to really look at the charts to understand what you were saying.
Sorry to be critical, but this stuff really is important. The message has to be got across very clearly and cleanly. If it’s not immediately obvious, people just won’t bother to look.
10/10 for content
4/10 for presentation
To be honest, I nevr expected this to go viral
Sorry!
This is really interesting, however, to a complete novice to economics like me – please would it be possible to clarify or break down what specific non-unemployment benefits actually are, as well as the category of allowances and reliefs?
I think that if people could see the proportion of funding that goes to certain benefits like housing benefit, it would be really helpful as that’s been growing due to increasing rents and property prices.
That data is in the links
I’ve started a petition to get these tax summaries withdrawn. It’s going quite well – 3,000 sigs in three days – and I’m doing a press release to see if I can generate more interest.
If I give credit where it’s due, can I use your version of the pie chart, to illustrate how it should have looked?
You may
@Mike I’ll look for the link on Vox Political? Have you considered 38 degrees.
I have Richard’s chart with me whilst canvassing for the Green Party, its part of my “pocket brain”.
Frankly !
I sort of like the pie chart ! it will be helpful if the chart linkds to the data base to make it interactive to identify the sources methodically ! Other wise it seems the pie chart is facing unnecessary criticism ! This could be a good example of using a formidable knowledge base ! The simple factor is that the RPI in fact is downhill due to retail overstatements and Consumer goods price index being up in line with inflation however the borrowing increase reflects the economic fuck up ! Any way Mr. Murphy mightdo us all a favour if he can please upload an interactive pie chart with a forecast projection for those who are policy analysts and laymen ! It helps many economies to strategic re-positioning looking at what happens here mind!
Sorry!
I wrote this, like many blogs, in an hour or so, and never expected the impact it has had
Aince then I have had a planned operation
All the data is linked if someone wants to do the work. It is nit dependent on me
An excellently written analysis as always Richard.
Apologies if this has been covered before in the comments (and I its a very stupid question) but I don’t really understand the differentiation between explicit spend and your ‘tax spend’ – how is tax not collected considered an expenditure and why should it be included on a breakdown of tax expenditure?
Thanks
Hope I have answered this elsewhere
Sorry, energy still limited
I understand, and to a certain extent sympathise, with the point you’re trying to make with this analysis. But it is not informative or helpful.
“Tax spend” is a misnomer. It is not an expense, it is a decision not to collect. We have no way of knowing whether changing the way that tax is raised — who will be asked to pay relatively more than whom — because companies do not sit passively by when the tax code changes, they change what they do in response. We can see this most obviously from the Amazon and Starbucks issue, but it is also true in the more positive sense: if companies didn’t take tax into account when they make decisions, then tax breaks for research wouldn’t work. By the way, this also true for individuals, or there would not have been such a furore over VAT on children’s clothes.
Upshot: if you abolish loopholes or reduce “tax-spends” or “tax subsidies,” you have no way of predicting what the reaction will be, and therefore how much money the tax system will really raise. You could be off by several billion quid (indeed, the Treasury have been in the past, see 50% tax band). So your chart will be wrong.
But I have a bigger problem with this analysis, which is it confuses two distinct and separate questions: how the government raises money, and how it gets spent. I understand why politicians want to do this. On the right, it means they can raise taxes and pretend that they are “cutting government spending,” while on the left, it allows politicians to pretend that voters can have all the spending they want and “somebody else” will pay.
But you’re not a politician, so why do you have play that game?
If tax spend has the same effect as spend e.g. Tax credit is the opposite of benefit or increased allowance reduces benefit claim then they achieve the same goal and so suggesting they are different is the absurdity
This article is worth a read and defends why policiticans do what they do…
http://www.motherjones.com/politics/2013/09/new-study-politics-makes-you-innumerate
Hi Richard, interesting analysis thanks. Would you explain the reasoning for including the implicit subsidy to banks, please. As I understand it this is the value of the reduced cost of borrowing from third party lenders due to the perception governments will bail large banks out for being too big to fail, and so is not spending by the government, either directly or via uncollected potential revenue.
It is a cost we could and did bear and so quite fairly in the analysis as a government impact in my opinion that it need not but does supply with considerable contingent risk if it materialising