I take it as read that HMRC's tax gap data is nonsense: I have explained why that has to be the case many times, most recently here. But, that said it is still curious to look at its anomalies as some are telling. Take this table for example that I have prepared, simply comparing the make up of the last two reports as originally published:
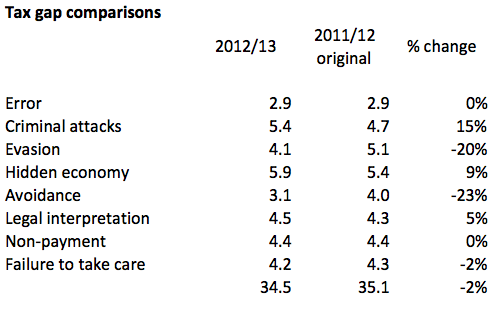
Does anyone really think it likely that tax avoidance and tax evasion have declined by the scales indicated? Is it really in any way plausible for example that tax avoidance declined by 23% in a year? Or come to that, that tax evasion would have decreased by 20% at a time when the number of self employed people was increasing by hundreds of thousands a year - and they are the people most likely to be doing this? The numbers lack any credibility at all, and so does the back up data where HMRC says this:
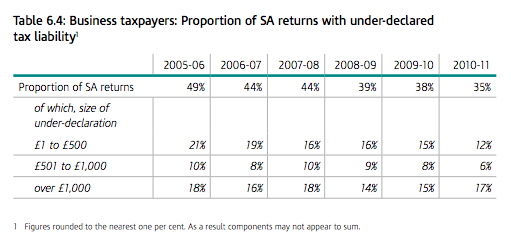
Apparently, despite the massive increase in self employment which was happening towards to end of the period this data covers and the massive decline in the number of tax officials the rate of tax compliance is rapidly improving. To be candid, there is not a hope that this is true. But to find out what chance there is we have to look at how the data is created. HMRC disclose this:
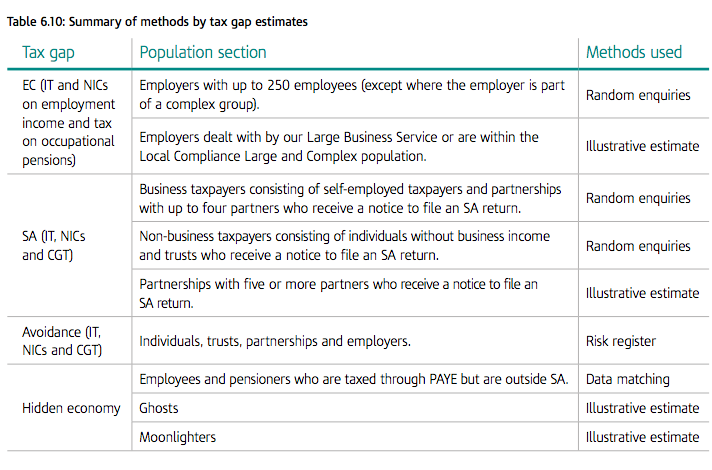
Illustrative estimates means, for all practical purposes 'we made it up'. Let's be blunt about it. That relates to the vast majority of the data on the hidden economy therefore. It is, quite ludicrously, a guess. If you don't believe me in their methodology document the best they say on this point is:
![]()
Making it up, in other words. And they have the cheek to challenge my reasoned analysis.
But then let's also look at 'random enquiries' as that sounds a lot more robust. Again in the methodology document they report the basis for these estimates:
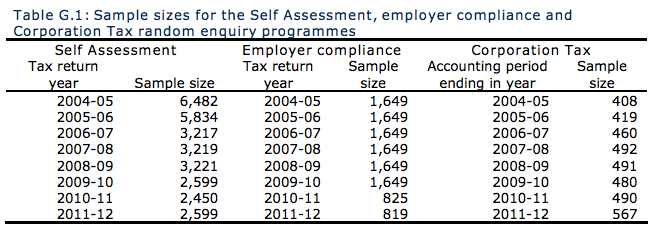
Note the collapse in sample sizes - halving in many cases over this period. Who says cuts have not had an impact?
But it's also important to note the proportionate numbers. In 2004-05 there were 4.64 million self employed people. In 2011-12 that was 5.49 million. The chance of being targeted fell from 0.140% to 0.047% a 66% decline over the period. What is the chance that more recent data is reliable in that case?
The same is true of companies. In 2004-05 there were 2,014,000 companies at the start of the year. In 2011-12 there were 2,686,000. The chance of an enquiry was almost static at 0.02% (one in 4,936 in 2004-05 to one in 4,732 in 2011-12). That's so small it's ridiculous.
Do I in that case believe these findings? Sorry - I don't. They may be illustrative estimates, to be kind to them, but they are very bad ones indeed. To pass them off as reliable statistics is fanciful at best.
HMRC should be hanging their heads in shame at the data and how poorly they reflect on its capacity to collect tax.
But finally let me deal with tax avoidance. Here the methodology says:
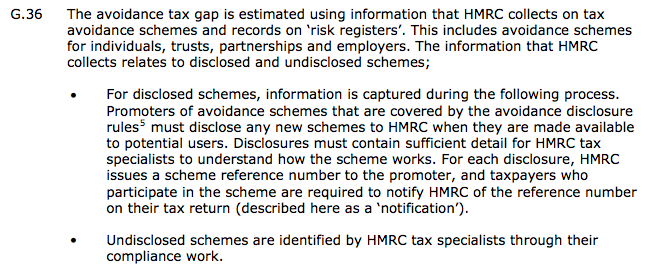
So let's be clear: avoidance is now defined as 'disclosed under DOTAS'. This frankly beggars belief. What it says is that if people get round DOTAS - because for example some well known companies undertake their tax avoidance outside the UK - then HMRC turn a blind eye to that avoidance altogether when estimating the tax gap It's very hard to comprehend an approach as unintelligent as this. But it does produce very nice statistics for HMRC. No wonder they are pleased with themselves.
I've said it before, and I will say it again - that if HMRC are this bad the whole organisation needs clearing out - starting, quite emphatically at the top.
Thanks for reading this post.
You can share this post on social media of your choice by clicking these icons:
There are links to this blog's glossary in the above post that explain technical terms used in it. Follow them for more explanations.
You can subscribe to this blog's daily email here.
And if you would like to support this blog you can, here:

 Buy me a coffee!

Of course, it’s also quite convenient that Avoidance and Evasion should appear to be falling so sharply at a time when the tax gap, and the reasons for it, are being pushed up the political agenda by people such as Tax Justice Network and UK Uncut. You couldn’t make it up, as it were.
Sampling error is approximately 1/sqrt(n) – so a random sample of 500 people should give you an estimate that’s accurate to within 5%. Good enough for this purpose, I’d think. I doubt the other estimates in their report are anywhere close to 5% accurate.
Quite what they’re doing wasting their time sampling 2000 or even 6,000 people I’ve no idea.
Of course that’s assuming the sampling is indeed random – if it’s not then the results will be junk regardless of how many samples they take.
You sample because you collect tax
Unless you sample enough the experience of being sampled is too small for the risk to be appreciated so it is assumed there is none
HMRC’s job is to recover tax – not know how much it loses
And the sample is not random. It is of returns received. And that misses the evaders – which is the whole point of the exercise which is why a top down estimate is needed and is studiously ignored.
In which case you agree with me
You should on both counts, in fact
No, you were suggesting the sample size was a problem. That is a misunderstanding of basic statistics.
No it isn’t…