This post is the third of the three that relate to the economic ideas underpinning the Taxing Wealth Report 2024. The first was on tax and money in the political economy. The second was on the national debt.
This note is a little more applied and demonstrates diagrammatically how money appears to move around the economy after a government has created it to fund its expenditure and the resulting tax and savings flows that rise as a result. It also demonstrates how those flows are impacted by QE, but more importantly, by the recommendations made in the Taxing Wealth Report 2024.
I've been asked for a diagrammatic representation of this sort for some time, but I have always held back because, to be candid, preparing these diagrams was not a straightforward exercise, and some of them went through a number of iterations. I also thought that four diagrams would suffice until, on review, the second and third diagrams were requested, and I realised that adding them made complete sense.
This post is long, with a total of almost 7,000 words in all. A PDF version is available here and might be easier to read for many people.
There are many conclusions that can be drawn from the diagrams in this paper, but a number appear particularly important.
One is that the government could borrow a lot more effectively and at a lower cost if it encouraged the people of the UK to save with it directly.
Another makes clear that the government's dependency on financial markets is not just fictional but is a fiction that the government itself has created.
Some figures are also very noticeable. One is that the estimated total cost of tax abuse since 2010 is, according to HM Revenue & Customs, £435 billion, although it could be much higher than that due to deficiencies in their methodologies.
The other is the total £800 billion cost of pension tax relief given since 2010.
These two numbers, together, explain more than 85% of UK government borrowing since 2010. Despite that, almost no attention is given to them in debates on tax, debt and economic issues. Highlighting such deficiencies in the quality of debate is one of the purposes of the Taxing Wealth Report 2024.
I hope that this paper is of use. Comments made in good faith will be welcome.
Brief Summary
This note is part of the background materials that seek to explain the basis for the recommendations made in the Taxing Wealth Report 2024.
In this paper the money flows created by government expenditure, and the resulting demand by a government for funds, are explained through a series of six diagrams.
The intention is to show how the Taxing Wealth Report 2024 seeks to:
- Maximise the fiscal multiplier effects resulting from government spending of new funds into the economy.
- Maximise the fiscal multiplier effects arising from the best choice of tax rates, meaning that those on low incomes should have low overall effective tax rates and that those on high incomes should have higher overall tax rates, which delivers this outcome.
- Provide reason why the government should encourage more direct saving in the savings products that it makes available for this purpose that together are often described as the national debt but which might be much better thought of as national savings.
- Explain the cost of tax abuse to the government in terms of excess borrowing that it has to take on as a result, which has amounted to not less than £435 billon since 2010.
- Demonstrate the cost to the government of pension saving subsidies that might have cost £800 billion since 2010, or fifty-five per cent of the so-called national debt incurred in that period.
- Maximise the fiscal multiplier effects from saving so that new investment can be generated from this activity which has not been the case for many decades in the UK, with a resultant boost to our economy, employment, and growth as well as to the creation of the capital infrastructure needed to address climate change and other social issues in the UK.
In the process the paper also hopes to expand understanding of the nature of the cash flows resulting from government expenditure and to slay some of the myths commonly told about that issue.
This paper suggests that the proposals in the Taxing Wealth Report 2024 will have larger positive multiplier effects than the existing tax system does.
Background
As the section of the Taxing Wealth Report 2024 on economics, money, tax and their intimate relationship demonstrates, much of what is true with regard to these matters is counter-intuitive to what is still commonplace understanding, particularly amongst politicians, economic commentators, journalists more generally, and tax specialists.
As that section makes clear:
- Government expenditure must precede the raising of taxation revenues or there would be no money available to pay taxation liabilities.
- The money spent by the government into the economy is newly created for it by the Bank of England every time that expenditure takes place. Most importantly, tax funds received are never involved in that process, meaning that they can never be a constraint on spending.
- The money created as a result of government spending financed by the Bank of England is withdrawn from circulation in the economy to prevent inflation taking place by way of taxes being charged and by what is commonly called government borrowing, but which would be much more accurately described as government deposit-taking from savers seeking a safe place for their funds.
- Government created money is called base money. It is not, however, the only money in circulation within the economy. Commercial banks can also create money, which they do by making loans to customers. Importantly, just as the government does not use tax revenues to fund its expenditure, nor do commercial banks use funds deposited with them to make loans to their customers. Instead, every loan that they make creates new money which is in turn cancelled when that loan is repaid, just as government created money is cancelled when taxes are paid.
To fully understand the role of tax in the economy, and the way in which the Taxing Wealth Report 2024 seeks to exploit that understanding to improve the well-being of people within the UK by both changing who pays tax and the way in which tax incentivised savings arrangements work within the UK economy, the money flows that government spending and tax (which really are the flip side of each other) create within that economy need to be understood. A series of diagrammatic representations of those money flows will be used for these purposes.
The following should be noted with regard to these diagrams:
- These diagrams might be entirely incomprehensible to some readers, and if that is the case, simply skip this chapter. Most of the Taxing Wealth Report 2024 can be understood without them, but it is hoped that these diagrams will assist understanding for some people.
- Diagrams, like maps, are representations of reality but are not real in themselves. They, inevitably, simplify matters to avoid excessive complication. It is important to appreciate that this has been done in the diagrams that follow.
- Crucially, the diagrams that follow are only intended to represent the flows arising from government expenditure and the government's consequent demands for taxation revenue and savings flows to the government. Flows primarily or solely associated with commercial bank money are not shown in the diagrams. It is accepted that this could be a basis for criticism of them, but there are two reasons for accepting this compromise:
- Firstly, the diagrams would almost certainly be incomprehensible if they also reflected commercial money flows.
- Commercial money flows are, in reality, impossible to differentiate from those created as a consequence of the use of base money within our economy, at least when we come to make payments through our own bank accounts. To abstract base money flows in the way done in these diagrams is not, then, a hindrance, but actually serves to highlight something that is otherwise not apparent.
First diagram – the essential tax, spending and savings flows resulting from government spending
The first of the diagrams that explains these money flows sets the pattern for all the diagrams that follow, in which it is always embedded as they grow in complexity:
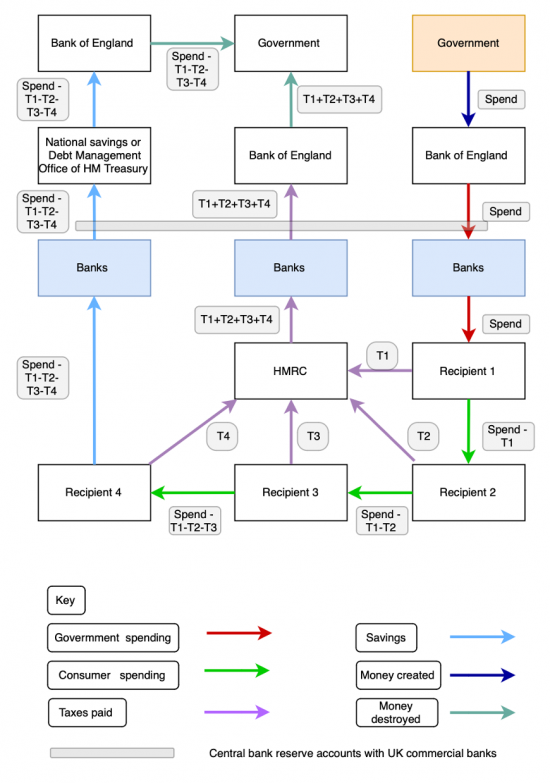
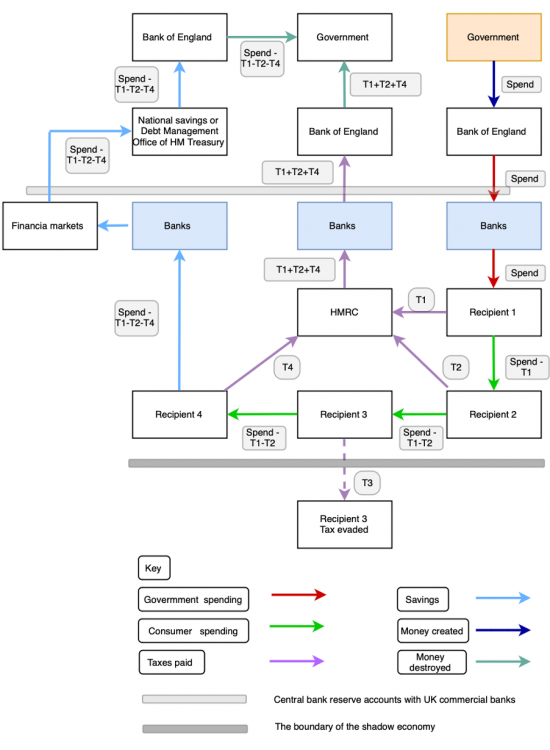
The process which the diagram portrays starts in the top right corner, with the government (indicated in this case by a box highlighted in pale orange) deciding to spend, as a consequence of which it instructs the Bank of England to make a payment. The Bank of England creates the money for the government to do so.
The Bank of England then routes this payment via the central bank reserve accounts[3] (indicated throughout the following diagrams by the grey line crossing the flows shown) to a commercial bank, highlighted in blue.
That commercial bank does, then, in accordance with the instruction that it has received from the Bank of England make payment to the first recipient of the funds from the government, effectively creating commercial money with the backing of the base money payment from the Bank of England in the process[4].
The identity of the first recipient of funds from the government does not particularly matter. It could be a commercial organisation receiving payment in respect of services supplied to the government, or it might be a teacher, civil servant, or NHS employee in respect of wages due, or it could be the beneficiary of a state pension or other state benefit. The important point to note is that they decide to undertake two transactions upon receipt of the funds.
One is to pay the tax due on the funds received, which it is assumed represents income in their hands, with that payment going to HMRC, and being described as T1 on the diagram.
The second payment that they make is to Recipient 2, from whom the first recipient buys goods or services to the value of the payment made to them, net of tax owing, to them by the government.
Recipients 2 and 3 then repeat the transactions undertaken by Recipient 1, except that the value that they will receive is reduced in each case by the amount of tax paid by previous recipients, so that, for example, Recipient 3 pays tax on the sum that they have received which is equivalent to the gross value received by Recipient 1 less the tax paid by Recipients 1 (T1) and 2 (T2). Recipient 3 then also pays tax (T3).
Recipient 4 breaks the pattern of spending following the receipt of funds. They make settlement of their tax liability (T4) but then saves the whole net balance of funds that they have received and does so by placing this net sum on deposit with a government agency. That agency might be National Savings and Investments (NS&I), or it could be the Debt Management Office of HM Treasury as a result of them buying government gilts. For the purposes of this exercise, it does not matter which. The essential point is that the funds that they have saved flow back through their bank and onward through the central bank reserve accounts to the consolidated fund of the Bank of England, and in turn, therefore, to the government's accounts. Money is cancelled as a result.
As will also be noticed, HM Revenue & Customs also collect the various tax payments made to it in a commercial bank (it usually uses Barclays for this purpose) which in turn then remits those funds through the central bank reserve accounts back to the Bank of England, and so once more to the government, where the money in question is cancelled.
The representation is, of course, simplified. It is very unlikely that each recipient will spend all the money that they have received with a single further recipient. Recipients 2, 3 and 4 can in this case be seen as typifying all the potential beneficiaries of the funds received by Recipient 1. Each of these might still, however, have taxation liabilities that will be settled.
It also need not be the case that no saving takes place until funds reach Recipient 4. There could be saving by each previous recipient, but this would only complicate the diagram.
Finally, it is, of course, the case that some funds might be saved with commercial banks or other entities, but this would then require that commercial bank created money be reflected in the diagram because it would then be commercial bank created money that would be redirected into savings with the government if, as the government always now does, it seeks to meet any deficits between its spending and taxation receipts by issuing bonds, Treasury Bills, or by attracting savings to NS&I.
These points having been made, the simplified diagram does represent the substance of the flows that are created by a single payment by the government to a recipient, for whatever reason it might arise.
The following points might then be made:
- As will be apparent, the tax generated by the government as a consequence of the payment that it makes is not restricted to the tax payment owing by the initial recipient. It is, instead, dependent upon the number of recipients of the net proceeds of the payment that there are until such time as those net proceeds are saved, and therefore taken out of circulation within the economy. Maximising the number of times that the net proceeds are spent increases the tax yield. The aim of the Taxing Wealth Report 2024 is, therefore, to keep those funds in use for as long as possible to increase the net tax recovery from the payment made in ways noted below.
- Increasing the tax rates on those who are most likely to save the net proceeds of the initial payment when they receive it, both at the time of that receipt and when they receive the income that they derive from doing so, provides some compensation for the failure of those persons to maintain the multiplier effect that might otherwise exist, and in the process provides compensatory tax yield because of their failure to pass those proceeds on within the active economy. This explains the desire in the Taxing Wealth Report 2024 to increase tax rates on savings.
- Reflecting these contrasting tax positions is one of the key underpinning economic logics of the Taxing Wealth Report 2024. By redistributing tax payments due from those on low pay to those on high pay the value of net proceeds circulated in the economy by those with high marginal propensities to spend (the lower paid, in other words) increases the likelihood that overall taxes payable as a result of government expenditure into the economy will eventually rise, whilst increasing taxes on those with high pay on both that income and their savings income is a recurring theme of the Taxing Wealth Report 2024 because doing so compensates for the low multiplier effect resulting from more of their income being saved.
This chart might be relatively simple but it allows these essential points to be made.
What the chart also makes clear is how a single payment can have impact much greater than is initially apparent. For example, assuming that each of the recipients noted on the diagram pays tax at an overall rate of 30% and the payments flow as indicated, and then assuming that the initial payment was of £100, the resulting flow of funds would be as follows:
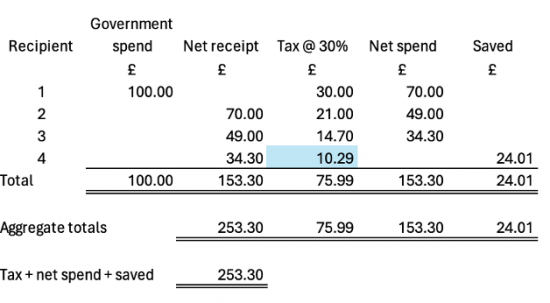
The total income recorded within the economy as a consequence of the initial expenditure of £100 by the government would be £253.30. Total tax paid will be £75.99 and the balance of the initial spend would be represented by £24.01 that would flowback into government sponsored savings products of one sort or another.
If it was then assumed that recipient 4 had a tax rate of 60% because they enjoyed a higher overall level of income that permitted them to save the entire proceeds of their labour, then the above noted table would change in the following way:
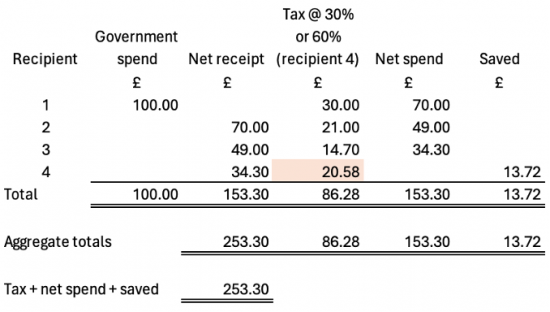
The tax paid by Recipient 4 would in this situation have doubled from £10.29 to £20.58, with a consequent reduction in their level of saving. Total tax paid would now have increased to £86.28 with the net balance of the initial £100 expenditure by government now being compensated for by reduced savings of £13.72. The scale of government borrowing is reduced as a consequence of the use of appropriate rate tax rates that reflect the relative incomes of the participants in this process.
Second diagram
The second diagram in this series is a simple variant on the first. The only change is in the use of Recipient 4's savings. Instead of these now going from Recipient 4's bank straight to National Savings and Investments or into a gilt holding which Recipient 4 then holds in their own name those funds are instead diverted into financial markets, where they are saved.
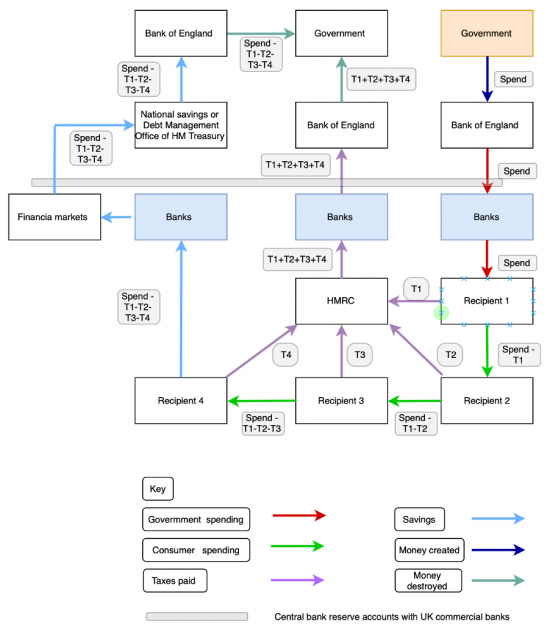
This then creates a situation where the government is short of cash flow, as it will not borrow on its Ways and Means Account with the Bank of England. As a consequence, an apparent dependency on financial markets on the part of the Debt Management Office of HM Treasury seems to be created as it appears from the flows credited by Recipient 4 that the Debt Management Office now needs to borrow from financial markets. It does not of course: it is only convention that demands that this borrowing take place. The diagram does, however, show that this borrowing does occur.
This diagram shows that:
- This borrowing from financial markets would not be necessary if the government, via the Debt Management Office, was willing to borrow direct from the public. As it is less than 0.2 per cent of UK government bonds are owned by the public, which makes almost no sense at all[5].
- The cost of government borrowing could be reduced if more use was made of direct borrowing from the public. NS&I pays less than Bank of England base rate on the accounts it provides, and less than the cost of gilt offerings in most cases. It could raise rates and still pay less than the cost of gilt offerings whilst being competitive in savings markets. To encourage the use of these accounts would, therefore, make complete sense.
- If the public held more gilts in their own names they would make a greater return than doing so via financial intermediaries who charge for arranging such holdings. It would be easy for the government to make this facility available, but it chooses not to do so.
- The myth of dependency in financial markets has, then, been created by governments: it is not true that it actually exists. Borrowing from financial markets is not necessary at all, and if borrowing is required there are other ways to secure funds.
The obvious conclusion is that the government is not minimising the cost of its borrowing by structuring its borrowing as it does. As importantly, it is not borrowing in a way intended to suit the needs of those who wish to save securely within its own population. In the process it has created an economic myth about its dependency on financial markets. It is hard to avoid the feeling that this is deliberate.
Third diagram
The third diagram is a variant on the second, for convenience.
The change shown in this diagram is that the third recipient of funds, Recipient 3, does not pay their tax and instead diverts their income and the tax that should have been paid on it into the shadow economy, as it made clear at the bottom of the diagram:
This does not mean that the money T3 receives cannot be spent: much of it might well flow through a bank account in the seemingly legitimate economy e.g. T3 might be a company that appears to be appropriately trading but never declares that fact to HM Revenue & Customs. They simply increase their own effective purchasing power by not paying the taxes that they owe. After all, why else would someone tax evade?
Their doing so means that Recipient 4 might receive more than they might have done as a result of T3 not paying their tax. It could be argued that the tax liability that Recipient 3 should have paid is simply passed on to be paid by Recipient 4 as a result, but that is not the case. If Recipient 3 received £49 (as noted in the example in the discussion on Diagram One) and should have paid £14.70 of tax on that, but did not, then Recipient 4 might receive £49 and pay tax of £14.70 but the tax that they would otherwise have paid of £10.29 on the net receipt that they should have enjoyed if T3 had settled their tax liability is lost, permanently.
The consequence of Recipient 3's tax evasion is that total tax paid is reduced and the sum saved by Recipient 4 is increased by the same amount, quite legitimately on their part.
Overall, however, the tax evasion leaves the government more exposed to borrowing if it wishes to balance its budgets.
Since 2010 HM Revenue & Customs suggest that the UK tax gap has totalled approximately £435 billion, assuming that the two most recent years for which estimates are not yet published continue to have tax gaps at the rate of the last published year[6]. The Office for Budget Responsibility has suggested that national debt over that same period has increased by about £1,450 billion[7]. In other words, almost exactly thirty per cent of all UK government borrowing over the period from 2010 to 2024 arose because of the failure to close the UK tax gap. Because of the weaknesses in the UK's tax gap estimates[8] the actual tax gap would be at least twice the amount that HM Revenue & Customs estimate. The evidence that large parts of the UK's national debt have arisen because of the failure to collect tax owing due to the underfunding of HM Revenue & Customs is very strong.
Fourth diagram
The fourth diagram in this series is based on the first diagram with the flows being expanded as follows:
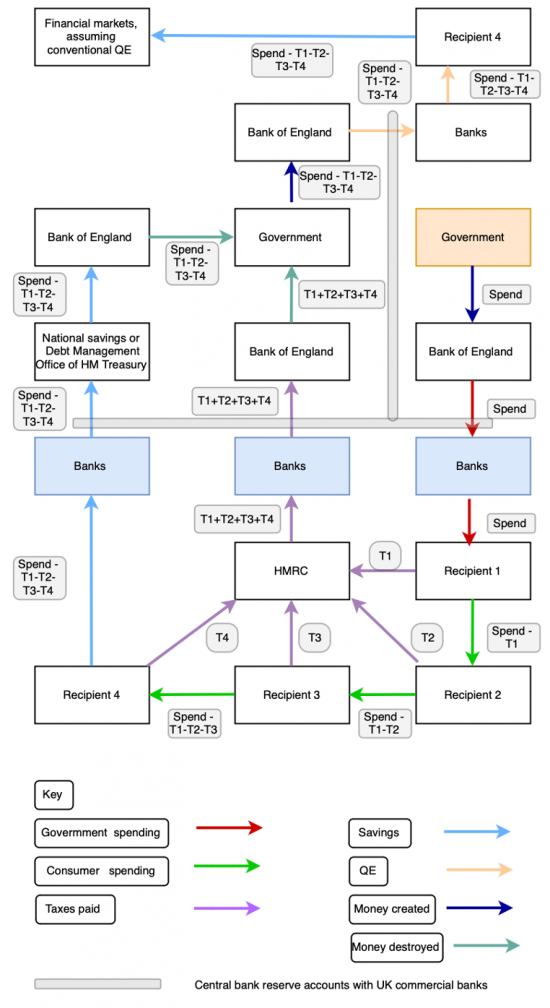
As should be apparent, except for four additional boxes at the top of the diagram, everything is much the same as in Diagram One. However, in this diagram it is assumed that quantitative easing (QE) is taking place. As a result, the government-backed products savings purchased by Recipient 4 in the previous diagram are now repurchased from them with new money created for that purpose. The Bank of England is effectively funded to do so by the Treasury, which has to give explicit consent for this action to take place[9]. The Bank of England then makes a payment to the commercial bank that Recipient 4 uses to settle this liability (as a result expanding the value of its central bank reserve account, with the grey line representing the boundary between base and commercial money that the central bank reserve accounts represent being extended to represent this transaction). Recipient 4, now being denied the opportunity to save with the government, which has effectively reduced the value of its product offering as a result of QE, has to instead save in the private sector financial markets, whose liquidity and value increases as a result, as was always the stated intention of QE.
The flows clearly suggest that QE:
- Reduces the value of government debt because that part previously owned by Recipient 4 is no longer available for sale, and is now owned by, and is effectively cancelled, by the government.
- QE has increased the liquidity of the financial sector, effectively by creating new reserves, which is what inflated central bank reserve accounts represent.
The sums saved in financial markets are treated as being outside the active economy shown at the bottom of the diagram because that is what the savings process does: it removes money from use in the active economy. As a result quantitative easing was largely used to fund speculation and not to fund useful economic activity in the UK economy, to its overall cost.
Fifth diagram
The fourth diagram can now be developed again in this fifth diagram of flows:
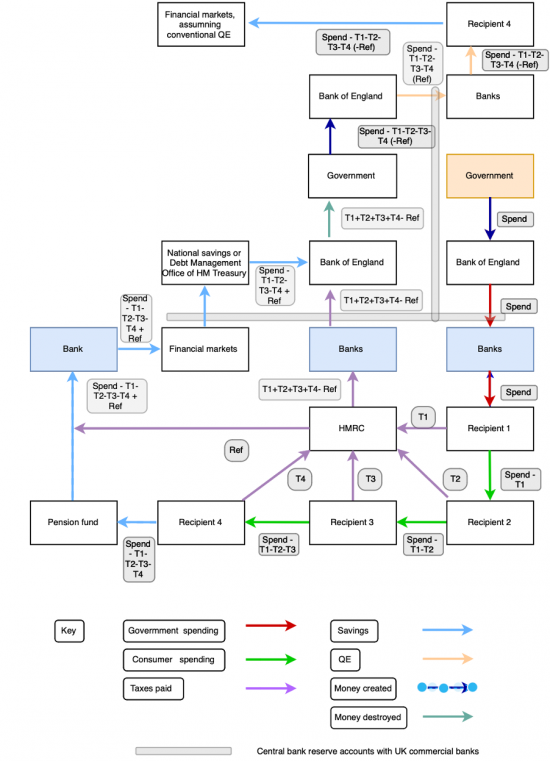
What has been added to the diagram here are pension contributions. It is assumed that Recipient 4 now decides that instead of saving in government-based savings accounts (gilts, or NS&I products) that they will instead be motivated by the tax incentive that the government provides to them to save the net proceeds of the receipt that they enjoy into a tax approved pension arrangement.
The whole of the net proceeds that Recipient 4 enjoys are now shown as going to a pension fund rather than to a national savings product. However, because of the tax incentives provided for pension saving, HM Revenue & Customs now provides a refund of tax paid by Recipient 4 to the pension fund which flows with the contribution that Recipient 4 has made through a bank account and into financial markets, where it is saved.
What is now apparent is that there are a number of costs to the government from this pension savings arrangement. One is, very clearly, that the cost of the tax refund made on the pension contribution reduces the tax flows from HM Revenue and Customs to the government via the Bank of England.
Another consequence is that savings previously held with the government are now held in financial markets. For convenience, it is assumed that these saved funds are then returned from financial markets to the Debt Management Office to be invested in gilts, so balancing the government's cash account, but what is clear is that these tax incentives are likely to reduce direct saving with the government in the way that they are offered at present.
QE arrangements are still, however, shown as taking place. That is because these are not necessarily dependent upon repurchasing bonds issued to savers in the current period, but can be used to purchase bonds put into circulation in earlier periods.
The fundamental point made is, however, that this tax incentive provided to pensions is a subsidy to financial markets that can potentially impact the government's own financial position by reducing revenue and by reducing sums saved directly with it. The government is then forced to borrow the cost of the subsidy it has provided to financial markets back from those markets if it wishes to balance its cash flows, paying for the privilege of doing so. If the government thinks itself financially constrained this demonstrates the very real social cost of the £70 billion cost of this pension subsidy.
The cost of subsidies that have been provided to those savings in pension funds since 2010 have amounted to approximately £800 billion. The increase in the so-called national debt over that same period has been approximately £1,450 billion. Approximately fifty-five per cent of all government borrowing since 2010 has been necessitated by the cost of pension subsidies provided to those using such facilities, most of whom were already wealthy enough to save.
Sixth diagram
A final iteration of this diagram can be offered to explain some of the changes to the tax incentives for savings made in the Taxing Wealth Report 2024.
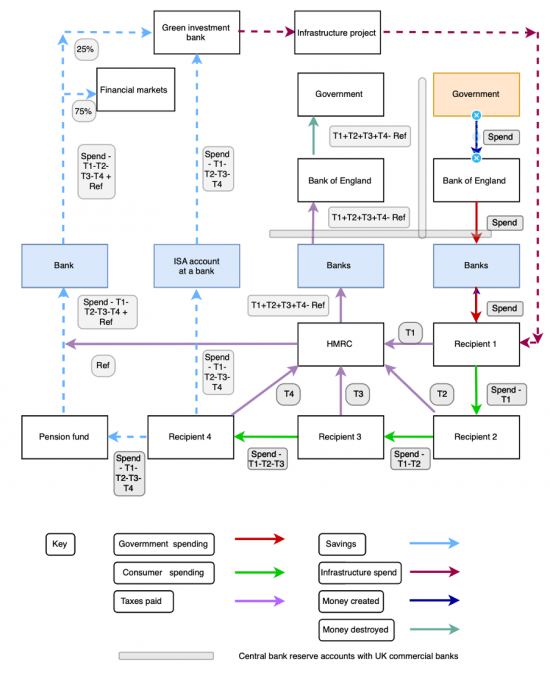
In this final diagram in this series, a number of new assumptions are made.
The first is that conventional quantitative easing has been cancelled, removing those parts of the diagram that referred to this.
Secondly, it is assumed that Recipient 4 now saves in one of two ways (or splits their saving in two ways: this need not be specific for the purposes of the diagram and explanation of it). Part is saved in a pension fund where, as is suggested in the Taxing Wealth Report 2024, twenty-five per cent is invested in a way that creates new infrastructure investment in the UK economy. For these purposes, it is assumed that these funds do not go to financial markets but do instead go to a green investment bank. Financial markets receive the remaining seventy-five per cent of the funds saved by Recipient 4, including their tax refund.
Thirdly, another part of Recipient 4's savings are placed in an ISA account at a bank, with those funds then being used by a green investment bank for the purposes of infrastructure investment in the UK economy, as again suggested as a requirement for ISA saving in the Taxing Wealth Report 2024.
As is apparent from the diagram, the changes to the required investment of funds saved if tax relief is to be enjoyed have a significant impact on the economy. Conventional saving, whether in cash or in traded financial products, has the effect of withdrawing funds from active use in the economy.
This is by definition the case when saving takes place in cash deposits, because they are never used to fund loans.
That is almost invariably the case with funds saved in financial markets because those markets very rarely provide new capital to businesses for investment purposes, but do instead trade assets already in existence, such as quoted shares already in circulation or buildings that have already been constructed. Funds saved in this way are, therefore, shown in this diagram as being removed from circulation in the active economy.
In contrast, funds saved in tax incentivised savings arrangements in the ways proposed in the Taxing Wealth Report 2024 are instead routed into new infrastructure projects, as the diagram makes clear.
In practice, although sums saved in ISA accounts do not enjoy the same tax benefits as pensions, meaning the total sum saved in an ISA by Recipient 4 is smaller than it would be in a pension because no immediate tax relief is received, because only part of pension savings are directed towards green and infrastructure investment and all of ISA savings are directed for use in that way in the recommendations made by the Taxing Wealth Report 2024, the actual benefit to the economy from ISA savings might be greater than from pension savings if the recommendations in this report were followed.
The consequence of saved funds being used as capital for infrastructure investment is that additional spending has to take place into the economy to secure the service of those who will work on these projects. The precise sum involved cannot be known given the options available in the diagrammatic representation shown, and therefore dashed lines are used for these purposes. However, what is clear is that these funds when saved in this way return from the savings economy into the active economy as shown by the line on the right-hand side of the chart.
Recipient 1, which could just as easily be a company as an individual in this diagrammatic representation, sees their income rise as a result of the spending on new capital projects. As a result, the whole process of fiscal multipliers described when discussing Diagram One, above, begins all over again as a consequence of this new input into the economy, which has indirectly arisen as a consequence of the change to the rules on tax reliefs associated with savings products. As such, instead of those tax relief now being used as an effective subsidy to both wealth and the financial services industry, they are now instead being used to promote economic activity in the country that then generates wealth and income. Fiscal multiplier effects result that amplify that gain. These multiplier effects are not, however, shown separately in this diagram because it would become too complicated.
Conclusion
Subject to the obvious limitations required when simplifying a complex system into diagrammatic form, these diagrams do demonstrate a number of the key economic ideas that underpin the proposals made in the Taxing Wealth Report 2024, all of which have been designed with the intention of creating more and more socially beneficial economic activity within the economy.
For example, in Diagram One the particularly important point is the existence of multiplier effects. The normal representation, commonly made by politicians, is that government expenditure is the equivalent of money being poured into a black hole. Multiplier effects make clear that this not the case. That is because government expenditure is, as must always be the case within any macroeconomy, someone else's income. That income is then taxable, almost invariably creating an immediate return to government, which fact is also almost never referred to when discussion on the way in which government is to fund its spending takes place.
As that diagram also makes clear, in addition to expenditure by a government creating new income for its first recipient, on which taxes are paid, that recipient can then create additional income for other people as they, in turn, spend the net proceeds that they have received after making settlement of the tax that they owe. This process then continues until saving takes place, which process of saving stops the multiplier effect working any further, assuming that the funds saved are then deposited in savings mechanisms that do not give rise to new investment activity.
That said, if that saving is in a government sponsored account then that return of funds to the government, which is what saving in this way does, achieves the apparent holy grail of government funding, which is of it balancing its cash flow, with tax receipts and borrowing equating to tax spending. The apparent benefit of saving in government sponsored accounts, which is sometimes called funding the national debt, is demonstrated as a result. If those accounts are in use, and properly promoted, no government should ever be able to claim that its books do not balance.
The second and subsequent diagrams expand this basic idea to consider various commonplace aspects of current government financing.
Diagram Two demonstrates that there is a cost to both the government and savers as a result of the government not encouraging people to save directly with it. Savers pay fees to financial market participants when they could avoid these by saving directly. The government, by not appropriately promoting National Savings and Investments (NS&I) might well pay too much for its borrowing. At the same time a myth of market dependency is created. None of this makes sense.
Diagram Three makes clear that there is a very real cost to then government from tax abuse. Since 2010 this might have amounted to £435 billion, or thirty per cent of total government borrowing over that period. Given that the tax gap is likely to be considerably underestimated by HM Revenue & Customs, this cost might be much higher than that. Failing to invest in HM Revenue & Customs directly fuels the growth of government borrowing. Again, this makes no sense.
Diagram Four considers the consequences of quantitative easing. What it shows are three things.
The first is that when quantitative easing is in use it does, in effect, deny consumers the choice of saving in government sponsored savings facilities, with them being forced instead to use alternative commercially available accounts. This is sub-optimal when it is known that cash-based deposits with banks do not fund loans, and therefore do not create new investment in the economy, whilst financial market based saving is almost entirely related to speculative activity, and not new capital creation. As such, this diversion of funds denies funding to the active economy.
Simultaneously, and secondly, because governments-based savings accounts are withdrawn from the economy, pressure from the supposed incurrence of government cash-flow deficits arises as a result. New money must necessarily be injected into the economy as a consequence, which is represented by an inflation in the central bank reserve accounts. These sums are then, in turn, reflected in an increase in savings in financial services sector savings accounts, with all the consequences noted above. Given that interest is paid on the central bank reserve account balances this does not make sense.
Thirdly, although it is not explicit within the diagram, the obvious conclusion can be drawn that if it is desirable to increase the quantity of government created money in the economy, and there have clearly been occasions when that is the case, doing so by increasing direct spending into the economy without seeking to recover those sums, at least for a period of time, through taxation would be a much more direct and effective method of doing so as this boosts the active economy in a way that boosting financial services sector saving does not. The government should run an overdraft with its central bank as part of fiscal policy, in other words, and avoid quantitative easing as a result.
Diagram Five incorporates pension saving into the flows. This is appropriate because the cost of subsidising these savings in tax terms might be around £70 billion a year according to the analysis presented in the Taxing Wealth Report 2024. Given this exceptional cost it is important to understand the consequences of this, which Diagram Five demonstrates.
The consequence of this subsidy is that pension savings and the additional tax refunds provided to boost them by the government flow out of the active economy and into the financial services sector where these funds are lost from use in that active economy for the reasons noted above. As a consequence, the government does either have to seek savings from the financial services sector to balance its cash flows, which makes no sense when it would be much better for those savings to be placed with it individually by those whom that sector serves, or it has to run increased cash flow deficits, which it will not do. The result is that this tax subsidised diversion of savings from the government to the financial services sector, coupled with the government's own illogical refusal to run an overdraft in its Ways and Means Account with the Bank of England, creates the appearance of the dependence by the government on funding from the City of London when no such dependence exists.
Since 2010 it is likely that the total cost of tax subsidies to pensions, and so to the financial services sector of the economy, has amounted to approximately £800 billion whilst so-called government debt has grown by £1,450 billion. The relationship between the two is not coincidental.
Finally, Diagram Six looks at what might happen if the government was to reform the tax reliefs associated with both ISA and pension savings as recommended in the Taxing Wealth Report 2024. It demonstrates that if the tax relief made available to subsidise savings had conditions attached to them so that some (in the case of pension savings) and all (in the case of ISA savings) were required to be used to provide capital for investment in new infrastructure projects supporting a climate transition then significant sums, which the TWR suggests could be more than £100 billion a year, could be made available for this purpose, with those funds then being returned from savings into the active economy where they would begin the process of creating fiscal multipliers all over again.
In other words, this simple change to the tax incentives attached to savings could fundamentally alter the funding available to tackle climate change in the UK whilst simultaneously providing a strong positive fiscal multiplier effect from doing so, which the current tax relief does not. In fact, current tax reliefs have a negative multiplier effect in this regard, because they result in the withdrawal of funds from use in the active economy by diverting them into financial speculation or cash deposits, neither of which result in new capital formation. It is for these reasons that these changes to the tax rules associated with savings products are promoted in the Taxing Wealth Report 2024.
Putting these various points together, what the Taxing Wealth Report 2024 seeks to do is:
- Maximise the fiscal multiplier effects resulting from government spending of new funds into the economy.
- Maximise the fiscal multiplier effects arising from the best choice of tax rates, meaning that those on low incomes should have low overall effective tax rates and that those on high incomes should have higher overall tax rates, which delivers this outcome.
- Provide reason why the government should encourage more direct saving in the savings products that it makes available for this purpose that are usually collectively called the national debt, but which might be better described as national savings.
- Explain the cost of tax abuse to the government in terms of excess borrowing that it has to take on as a result, which has amounted to not less than £435 billon since 2010.
- Demonstrate the cost to the government of pension saving subsidies that might have cost £800 billion since 2010, or fifty-five per cent of the so-called national debt incurred in that period.
- Maximise the fiscal multiplier effects from saving so that new investment can be generated from this activity which has not been the case for many decades in the UK, with a resultant boost to our economy, employment, and growth as well as to the creation of the capital infrastructure needed to address climate change and other social issues in the UK.
Footnotes
[1] N/A in this version
[2] Multiplier effects measure the amount by which national income is increased or decreased as a result of additional spending within an economy. If a multiplier effect is greater than one then the additional spending produces an increase in income of greater than its own amount, and vice versa.
[3] See https://www.taxresearch.org.uk/Blog/glossary/C/#central-bank-reserve-accounts for an explanation of these the role of these accounts.
[4][4] See https://www.taxresearch.org.uk/Blog/glossary/B/#base-money for an explanation of base money
[5] https://www.dmo.gov.uk/media/xl5bo4as/jul-sep-2023.pdf
[6] https://www.gov.uk/government/statistics/measuring-tax-gaps/1-tax-gaps-summary
[7] https://obr.uk/download/public-finances-databank-november-2023/?tmstv=1707402181
[8] See https://taxingwealth.uk/2023/09/19/the-taxing-wealth-report-2024-the-uk-needs-better-estimation-of-its-tax-gap-to-prevent-the-illicit-accumulation-of-wealth/
[9] See the letter establishing the Bank of England Asset Purchase Facility (APF) in which it was made clear that a) the Bank of England would act under direction from the Chancellor of the Exchequer and b) the Bank of England would be indemnified for any gains and losses that it made as a result of undertaking activity on behalf of HM Treasury and c) note the fact that as a consequence the accounts of the APF are not consolidated into those of the Bank of England because it is not a subsidiary under its control. https://www.bankofengland.co.uk/-/media/boe/files/letter/2009/chancellor-letter-290109
Thanks for reading this post.
You can share this post on social media of your choice by clicking these icons:
You can subscribe to this blog's daily email here.
And if you would like to support this blog you can, here:


Frankly, this is simply too good to ignore and is worthy of being taken up more widely.
It should be published – with each area of abuse – or lost income – with its own chapter and the above conclusion.
It is sad that you have to enter the world of ‘using tax to pay for stuff’ at all although we know that this can be a choice.
But for me it illuminates the insistence of politicians on tax income to pay for stuff but also reveals no or little intention to draw on the tax revenue to actually do this – something that is also in politician’s control.
In other words, there is no honesty at work in this issue at all except what you Richard have produced here.
I am beginning to think eriously about the next book…
Far be it or me to direct your work or your effort but a book about this might be just the trick.
Would some MMT colleagues be able to endorse it/help with drafts?
All the work you have done on it , it looks like a working draft when you add it up.
Well, to me at least.
I have spoken to someone I know in MMT….
Thank you Richard….this is a real ‘light bulb moment’ post.
Thanks
Very valuable, not least as another perspective on , and summary of , the TW contents.
For my own purposes I might try to see if its possible to have just one box for each entity – eg BoE – but that may result in too many confusing arrows flowing in and out and criss crossing etc
That was the problem…..
Thank you very much for this very comprehensive study.As a person of everyday normal intelligence (like millions of others )I am finally starting to grasp the concepts you have been advocating for years.
The diagrams were most helpful for me in conjunction with your explanations. I have saved them for future reference.
Hopefully I can continue to learn and spread the word with some confidence.
Thank you once again.
If it works for anyone it was worthwhile doing. I am pleased.
Bravo Richard!
When I was a young research manager with a large multinational company I was sent on a training day to learn about patent protection.
The company’s patent attorney explained that anything important that was developed, could either be kept as a trade secret or he would seek patent protection using each country’s patent law.
But once granted, a patent would enable everyone to know how to make the product or perform the process and they would then have to work hard the circumvent it in order to gain some (but maybe not all) of the advantages.
In trying to understand the real nature of money, it seems to me that it has always been the invention of monarchs assisted by powerful servants as it suited their purposes in facilitating trade and it enabled them to accumulate wealth.
But as economies developed and monarchy was ousted by the rich and powerful, the need to ensure that money could still be accumulated, it’s real nature became something of a trade secret of those in power. So they orchestrated and managed a breathtaking level of obfuscation and the continued ignorance of successive generations.
What you have produced, especially when printed off as a PDF, is a simple demystification and straightforward to follow. It should be essential reading for all MPs as well as anyone seeking to represent us at a local government level and it should be a key part of the training for all civil servants and taught in every school.
I think all of us following your blog should be setting our printers to work, buying lots of envelopes and stamps and sending our MP’s, councillors, civil servants and key journalists full printed copies of Tax and Money Flows Within the Economy plus a link to the finished Taxing Wealth Report 2024.
Change starts with education
Thank you
Thank you,
This has been very helpful to my understanding.
The only comment I have (and I do agree on your proposals for pensions and green savings bank), is that pensions do make their way into the active economy but this is many tens of years down the line after the money has been put into a savings account, your proposals for pensions would make some of this money available in the active economy immediately, rather than the drip-feed from current pensioners.
Thanks once again.
Fair comment
Further, if we were able to direct the tax relief available to pensions into a higher state pension instead, there would be an immediate increase in active money and it would disproportionately benefit those at the bottom of the pile.
This is a brilliant piece of work.
I can’t claim to have assimilated the whole document yet, but it appears to lift the shroud of obfuscation that surrounds the core of our economic system.
Thank you.
Thank you
Thank you again.
Comprehension is in the way ‘the book’ is presented and how it appears on the page.
Ive always been drawn to the Dorling Kindersley publications.
The money in the economy could be seen like an ecological system, where it is clear what is healthy and life giving as opposed to what we have now, which drains us of life and our futures.
The diagrams of the flows within the economy assume a closed system apart from tax evasion. Is a trade or current account deficit the equivalent of tax evasion in the it diverts money outside the system where it can’t be taxed or the savings don’t flow to the Bank of England.
No, in a word
We are talking sterling flows here
And in any event I think offshore tax evasion is much less of a risk that it was, and I take some credit for that
Oh this is good – thank you for publishing (and directing me to it!).
Thanks