According to the Office for National Statistics release on the December 2021 government finances, published yesterday, this happened:
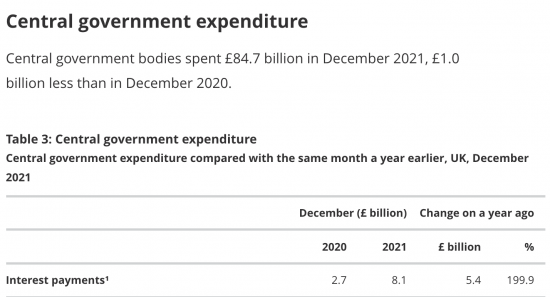
That's an extraordinary increase in interest payments for a month. It makes it worth looking at.
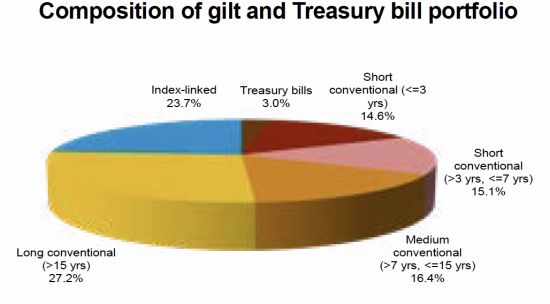
This is the composition of UK national debt at present according to the Debt Management Office:
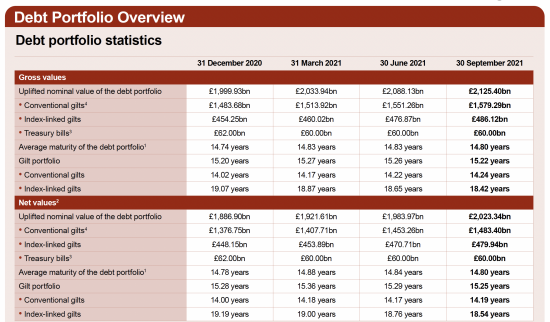
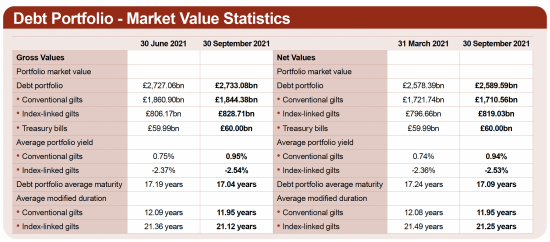
Market prices were above issue price:
The premium is 15.3% on conventional gilts in September 2021 and 18.4% in March 2021.
To summarise the split was as follows:
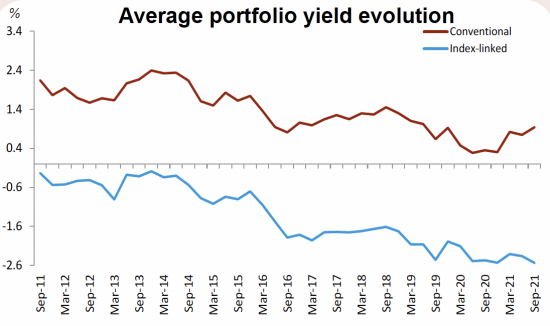
And the rates of return were as follows:
And just for the record, the gilt holdings were as follows:
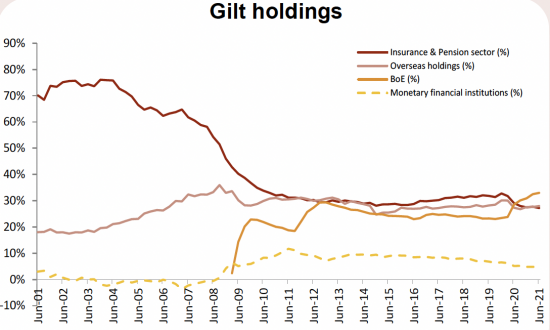
33% of all gilts are owned by the Bank of England. None of these are index-linked.
To understand index-linked bonds we need to know changes in the retail price index to which they still appear to be linked according to top the data I can find. Over the last thirty years or so RPI moved like this, based on ONS data up to the end of 2021:
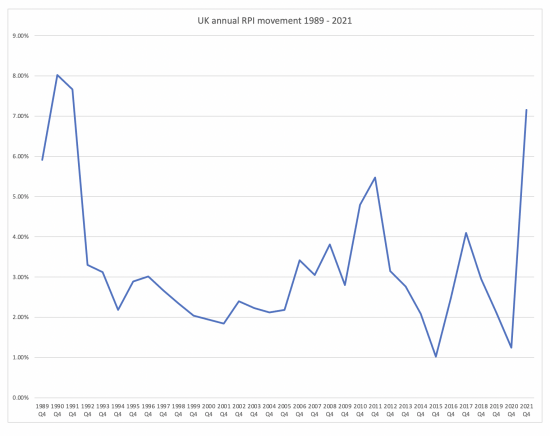
To be precise, this index was measuring 1.25% annual change in December 2020 and 7.16% in December 2021, an increase of 5.91%.
So, let's summarise this data. Using net debt in issue (i.e. allowing for bonds owned by the Debt Management Office itself:
- There was technically £2,023bn of debt in issue
- Of this £480bn was index-linked
- At issue price £668 billion of government debt was owned by the Bank of England - a figure that seems very low given that £875 billion has been spent on this debt but which roughly accords with other data from the ONS, so I will accept it
- This leaves £885 billion of conventional debt actually in issue.
Now let's estimate interest owing.
- Most index-linked debt carries little or almost no notional interest - anything between 0.125% and 0.5%. I will use 0.3%.
- The average noted yield on conventional bonds across the portfolio was 0.94% according to the Debt Management Office, which was up by about 0.2% on a year ago. However, this is calculated on market value. That means on nominal value rates need to be inflated to allow for this.
So, using a simple calculation and assuming little real debt issue in the year - which is true because of quantitative easing, then:
- In December 2020 conventional gilt interest cost was based on net debt of around £900 billion at about 0.75%, divided by 12, of course, or less than £0.56 billion. If the Bank of England owned debt was included it would be around £0.9 billion. Allowing for rates on nominal rather market value this can be rounded up toward £1.1 billion in cash cost.
- Index-linked bonds in December 2020 would have yielded maybe 0.3% plus RPI or about 1.55%, meaning the costs was maybe £0.6 billion
It's hard to see where the figure of £2.7 billion comes from on this basis.
In December 2021 the same figures would be:
- Conventional gilts, £885 billion at 0.95%, or £0.84 billion. Grossing this up to allow for rates being quoted on market values this rounds towards £1 billion. Grossed up for total debt the notional (not actual) cost might be £1.5 billion
- On index linked stock the rate my be 7.5%. That implies a cost for the month of around £3 billion.
- The combined real cost is unlikely to exceed £4 billion, and maybe £4.5 billion including on government owned debt.
The claim is, however, that the debt cost in the month was £8.1 billion.
I accept that my calculations are assumption laden. I have also erred on the side of caution. should add that this is completely normal in any form of accounting review of this sort where plausibility of a reported figure is being considered. Given that caveat, I still find the reported figure for interest incomprehensible.
The figure would imply an annual cost of nearly £100 billion. On market prices of gilts, gross (i.e. including government owned debt) that would imply a rate of return of 3.8% overall, and that is not happening, I suggest.
I have read, carefully, what the ONS has had to say on this issue. What seems most likely is that the figure reported is not a charge for December alone, but a sudden recognition that they had not included an appropriate sum to allow for the impact of increasing inflation on interest costs in earlier months. In effect, they were playing catch up, but not disclosing the fact. If so, the cost is much lower than implied during the month, and ONS accounting needs to be improved and greater candour in disclosure is required. As it is, the accounting is not good enough.
I will be asking the ONS to justify this claim, because I cannot.
Thanks for reading this post.
You can share this post on social media of your choice by clicking these icons:
There are links to this blog's glossary in the above post that explain technical terms used in it. Follow them for more explanations.
You can subscribe to this blog's daily email here.
And if you would like to support this blog you can, here:

 Buy me a coffee!

Your “back of the envelope” calculations seem sensible to me.
One thought occurs to me – are the interest costs for a particular month on an “accrual” or “cash” basis? If cash, then you would get some very chunky payments in some months when coupons are paid.
That does not explain a 200% increase but I suppose, theoretically, if new issuance of gilts over the last year focused on a particular bond that paid coupons in December and June. (But assuming a 1% coupon paid semi-annually a £4bn increase in interest payments would imply £800bn of issuance in this particular bond!)
Not sure what I have suggested is true…. indeed, it seems unlikely… but the alternative is that the ONS data is nonsense.
The ONS is quite proud nit to follow accruals accounting conventions that are designed to give a fair view
The trouble is that they are also quite happy with the false views this gives rise to
I suspect that and your explanation may be in play here
Your calculation for inflation linked bonds is totally wrong. It is obvious you don’t understand how they work.
Which is why you are getting the wrong answer. One of the many reasons at least.
It is also incredibly arrogant to claim on the basis of your error-strewn and assumption laden calculation the ONS have got things wrong (which they have not) and they somehow owe you an explanation.
Rather than making up some bogus calculation you could simply have got the freely available Gilt issuance and coupon data. Which would show you the ONS data is spot on.
I used a back of an envelo[pe calculation to sanity check the ONS claim
I never said otherwise
Now show me how the ONS is spot on – provide all the links and the workings if you are right
Bit given the answer cannot be an annual cost of £100bn I know you are not
At one time interest was paid on that part of the debt which is QE – which is then sent back to the Treasury afterwards. More an accounting trick which nets off in the end. But you have to show the interest paid on one side.
There were changes made to this method, can’t recall if significant though during the later years of the Coalition which I haven’t kept up to date with. A bit like accounting. It’s hard if you’re out of the game to keep up.
The netting off still happens but the ONS pretends that the gross sum is paid
It’s not my job to do your work for you.
But consider that:
1. The ONS are given the DMO data directly, which is going to be accurate, given it relates to real cashflows.
2. Your calculation assumes that bond issuance is even in every month, which it is not.
3. You ignore the interest paid on bank reserves, which thanks to QE is now significant.
4. You get you calculation for the interest paid on Inflation Linked bonds horribly wrong. It is very clear you do not understand how they work.
But more to the point. I think it is incredible you seem to think that your back of envelope calculation is correct and the ONS, who are provided with the actual real life cash flows for their data, is wrong.
It is even more arrogant to think they owe you some kind of explanation – which would serve only to correct the errors you have made.
The standard trolling reply!
What is clear is
a) You do not understand the difference between cash flow and accounting
b) The timing of bond issuance has nothing to do with accounting as properly understood
c) Bank reserve costs are immaterial (around £2 billion a year now)
d) Redemption costs cannot be based on mon thly rate variations
So, wrong on every count
I think you are just highlighting your lack of understanding with your responses.
a) In this case, we are talking about a monthly number for debt interest payments. Not GAAP accounting. The data is taken from the real, known cashflows.
b) With reference to a) above, the timing of issuance does matter. Bonds pay coupons typically twice a year, so the exact month a bond is issued matters a great deal for monthly debt interest payments. It would not matter at all if looking on an annual basis, but given we are only looking at December.
c) I assume you are simply calculating based on the amount of outstanding QE. This is not the same as the total amount of outstanding deposits with the BoE, which is a far larger number.
d) Inflation linked bonds face (and therefore redemption) value vary monthly based on the RPI index (with a lag). By design. That’s how you achieve the inflation protection. Not by adding RPI in percentage terms to the coupon, which is what you seem to think.
Which just shows your lack of understanding of the product. By taking the un-inflated £480bn number to use in your estimate, you have immediately got it wrong.
If you get that basic point wrong, why should anyone trust any of the other assumptions you’ve made?
And as I say, the ONS have access to the actual, real world data. It is far more likely to be accurate than your back of envelope calculations, which as I have shown above, are already full of errors. So why do you think the ONS has any sort of case to answer to you, of all people?
More gibberish
a) The figures you suggest right are not GAAP consistent, I agree, bit then it should have been highlighted they were exceptional and not a cause fort concern, but they were not
b) With a lag timing should not matter
c) I was using Bo E central bank reserve accounts – and they are very close to QE numbers – showing how little you know
d) I know – but that is inconsistent with your comment (a)
People who I know do know here (Clive and Phil Stokoe) are intrigued
You are blocked for trolling because you will not actually engage in debate
I have downloaded the data for December 2020 and December 2021 from the DMO (yes, rather sad, I know) and done the exact calculation. (It includes BoE holdings)
For Dec 2021 the number is £3.3bn and for Dec 2020 it is £3.4bn. So, not sure where the ONS data comes from.
(With regards to Index Linked gilts, the high rate of inflation has not really “kicked in” yet as there is a lag and besides, the coupon is “fixed” with the principal amount getting inflated. So, a £100 face IL gilt with a 1% coupon will pay £1 in interest this year…. if inflation is 10% its “new” face value will be £110 and the interest payable will be £1.10. (NOT £10)).
In short, the exact calculation supports Richard’s point.
Thanks
Audit analytical review always suggests using a different methodology to that used in the first place
But this is useful
Does the interest payments figure count only gilts with a predetermined fixed or index-linked coupon? Does it include other interest, for example on bank debts, on which the increase of the base rate in December may be relevant?
Elliot, rather than throwing insults, can you help us out with a link or two, or summarise the calculation to explain why the amount has tripled. It is in effect two numbers – debt times average return. So what are those numbers, and why?
I did a perfectly reasonable, albeit back of the envelop, but evidences analytical review
I did ignore debt on bank deposits with the BoE. Maximum December liability was £0.2 billion
Clive’s calculation is helpful and suggests this is not just accruing for interest payable.
I should have read the ONS page first: pretty much all of the difference seems to come from “In December 2021, the RPI uplift on index-linked gilts was £5.5 billion. … These movements are reflected in the government’s liabilities, which will be realised as the existing stock of index-linked gilts is redeemed.”
So, are they accruing for (or providing for) an increased payment due on redemption, not just the increased cost of servicing interest?
Maybe
But will they be due?
Do we really think inflation will stay at this rate?
Hi Richard,
At first glance, this does look a bit odd! But I went back and looked at the ONS monthly time series for central government interest that ONS publishes (data back to April 1997).
Over this long time period, the average monthly interest is 3.1bn, but there are plenty of months that are considerably more than the average. Interest payments were almost 9bn in June 2021, for example, 7bn in October 2018 and there are outliers in the other direction too – in March interest payments are much lower, even turning negative in March 2019.
Now, what’s going on here?!?
My first question, as Clive Parry mentioned, is whether interest is on a cash or accrual basis – if its cash, then we should expect very erratic amounts to be shown monthly. That said, I think the data is supposed to be on an accrual basis, with interest accruing daily – which should lead to much less erratic monthly interest numbers – so this messy pattern of monthly interest becomes more puzzling.
I therefore wonder if this might have something to do with the UK’s stock of index linked bonds, and when the principal of the bond gets adjusted upwards (or potentially downwards) in line with RPI). An upward adjustment of principal on an index linked bond gets recorded as interest according to the statistical guidance ONS follows here, and I therefore wonder if this is linked to the CPI or RPI in specific months, which ends up meaning the uplifts in principal get recording in a “lumpy” way.
Anyway, its an interesting question, and one that might be worth asking – how do ONS (or more likely, the DMO, as I suspect ONS simply take the data they are provided with) record interest on index linked bonds?
I will be asking them…
This is nonsense accounting and they have a duty to do better than that – especially if they are going to highlight an issue as if of concern
Genuinely interested to know the answer to this one!
If they are providing for the increased repayment due on redemption of index-linked gilts, then it seems a little odd to account for it in a line item labelled “interest payments” without further comment.
I’ll freely acknowledge my lack of knowledge on this question, but I would expect “interest payments” to show amounts of interest that either (on a cash basis) have been paid or (on an accruals basis) will eventually be paid. Is the uplift payable on the redemption of index-linked gilts commonly referred to as an “interest payment”? I suppose it represents a finance cost for the issuer and a finance return for the holder, but as far as I am aware, unlike coupons, it is not taxable as interest income.
Let’s find out…
I think Phil is on the right track. If I take the end November and end December outstanding amounts of Index linked gilts (adjusted for the “uplift” I get a total increase of close to £6bn. That would explain the numbers.
This then leaves the question “does the number given by the ONS represent what one would normally consider ‘interest’?”
Personally, I think not. Generally we want to look at
(a) the amount of debt – which could be measured as nominal amount outstanding (ie. if you just let the bonds mature over time, how much would you have to pay back) or market value (ie. how much you would have to spend at today’s prices to buy back all the debt and cancel it).
(b) Cost of servicing this debt – how much do we have to pay each year to prevent default on the outstanding debt.
To my way of thinking uplift should be treated only as an increase in the stock of debt or you end up “double counting”.
I agree with you…
Richard
Further to Clive’s point about whether the ONS number “represents what one would normally consider ‘interest’?” I’m a bit surprised to see someone suggesting that it does not.
Very broadly speaking, interest is the difference between an amount lent and the amounts received by way of repayment. Some of this is labelled as “interest” and matches the lay person’s idea of what interest is, but some is not.
Consider a treasury bill, with a face value of 1000. These are typically issued at a discount – so a creditor buying a UK treasury bill might pay 998 for the bill, receiving 1000 back at maturity. The difference between issue price and the redemption value of 2 is recorded as interest, accrued over the life of the bill.
Now consider a regular coupon bond, issued at par, with a face value of 1000, and a coupon of 5%. Over the life of the instrument the creditor will receive coupons, recorded as interest, but at maturity will get the final coupon, and his 1000 principal returned. The 5% interest has to be high enough, for the rational investor, to protect the value of the 1000 originally lent.
But the investor might be willing to buy an index linked bond with an initial price of 1000 and a lower coupon, say 2% (assuming inflation expectations over the period of the bond were 3%), because while over the lifetime of the bond, coupons would be lower, at maturity you’d receive not just the 1000 you lent originally, but 1000 + an uplift for inflation.
In economic statistics we record discounts to face value on T-bills (or other bonds) and regular coupons, and uplifts of principal due to index linking as interest – to make sure that we don’t record different amounts of interest across countries, thus mucking up concepts like expenditure, the deficit and the primary deficit, depending on the debt instruments issued by the debt management office.
The question is when do you recognise the uplift and why? The approach appears decidedly arbitrary. Financial accounting is not.
“The question is when do you recognise the uplift and why? The approach appears decidedly arbitrary. Financial accounting is not.”
This raises an interesting question. Financial accounting has been built out of a conventional annual accounting cycle. The time frame is annual. I am not sure whether we can view Government accounting as ‘annual’. Historically Government debt was undated, rooled over, consolidated; and paid back over hundreds of years. This is a different kind of beast.
But e do set time frames on gvernment
Annual tax cycles
Annual budgeting
And so on
So the accounting has to be annual too
What makes Government different is that its monetary status is quite different from the annual budgeting cycle (an approach to the problem which reflects the contextualisation of all government issues as if they were solely capable of interpretation through conventional ‘corporate’ lens, or high Street banking terms); they aren’t. I am not convinced this is fixed by insisting on accountancy conventions simply awarding priority to ‘corporatisation’; because iss always been done that way. Remember the ‘hierarchy of money’ (because of a similar problematic relationship between money and credit, that reularly produces badly unforseen crises); I propose there is a hierarchy of Government debt that requires a different framing to the annual budget cycle;.
But try to et any human to think in anything but annual cycles…
Sorry, but that is an ask too much and we have to respect realities
But it is reality. It is a matter of presentation – of reality. Making it fit an annual cycle is the misleading element. We do not prsent distant objects in the universe in miles or kilometres. We present them in the dimensions that present the facts and recognise the realities; in “light years” An object that is 4 light years away can be converted into miles (to fit our perspective); that would be around 180,000 x 60 x 60 x 24 x 365 x 4 = the absolutely pointless. Notice that physics determines the quantum in time. That is reality.
Of course the context of Government debt versus annual cycles is not of the same quantum of difference, as distances on earth and in extrasolar astronomy; but the importance of the difference in financial and economic terms should give us pause, because it affects how and why we form critical policy.
All accounting suffers this conundrum
All boundaries in accounting suffer some degree of permeability and the possibility of arbitrage, including that relating to time, which is a particularly difficult one.
However, time is a natural function and one with which we are not only all familiar, but which has regulated the passage of life and the necessary decision-making that takes place within it for maybe tens of thousands of years with overall advantage arising. In that case I see every reason to respect the convention.
Well, I shall not attempt to over-extend this debate, but I would point out Mr Parry’s example from his useful discussion with Mr Stokoe; we have a choice between understating the cost of interest, versus “pretty lumpy changes that don’t really tell us much (ie. has the cost of servicing our debt really tripled over the last year? I don’t think so.)”. Neither of these ‘solutions’ seem to me to serve any valuable insight into the state of debt or its real cost. We could, however reveal the real nature of the different timescales; and certainly better than the standard febble hand-wrining about the lecay for everyone’s grandchildren (as if we weren’t the grandchildren of someone else’s long legacy of debt). There comes apoint when we all have to see the larger picture’ it isn’t, or shouldn’t be a secret.
In ‘The Prime of Jean Brodie’, Muriel Spark’s sharp protagonist acidly describes chrysanthemums as “very serviceable flowers”; in my view Mr Parry’s offered dilemma of understated cost or lumpy, duff data trenchantly points to the fact that the current alternatives aren’t even serviceable.
Hi Richard,
I think the text Andrew found solves the mystery, and is in line with my earlier comment. ONS wrote “In December 2021, the RPI uplift on index-linked gilts was £5.5 billion. … These movements are reflected in the government’s liabilities, which will be realized as the existing stock of index-linked gilts is redeemed”
What they mean by this is, that on an index linked gilt, the value of the principal is increased in line with RPI, and I presume in the UK for long life instruments, takes place once per year, in line with a stated monthly RPI (in the same way that some other things like train fares or pensions are responsive to RPI / CPI in a specific month).
So, if RPI is high in, say November, the value of the principal is adjusted upwards the following month, and importantly, this increase in the value of the principal is recorded as interest. Hence the December 2021 spike. Note that it gets recorded as interest, as an index linked bond can be issued at a lower interest rate than a non-index linked bond with a similar maturity, as for the former, the purchasing power of the principal is protected, but in the latter case it is not. Rational market players should see these two types of instrument as broadly substitutable, but in statistics we don’t want to to record less interest for an index linked bond than a standard coupon bond, as its possible the government would end up paying back the same amount in interest and final amount payable at maturity under either instrument.
Anyway, as long as the underlying index keeps going up, so will the value of the principal in an index linked bond (as the point of it being index linked is to ensure that the amount lent to government retains its purchasing power) – but if RPI ever turned negative in the critical month or period, its possible the value of the bond would fall, and this would be recorded as negative interest.
There are methods to smooth this effect, but perhaps ONS does not do this, hence the odd looking spikes, but I think the logic is fine – if you have a lot of index linked bonds, and the principal is index too, then if the index spikes, then this will cause spikes in interest, as they get accrued at the point at which they crystalize.
You may wish to reconsider the strength of some of your statements in this piece regarding what ONS is doing here, I think the approach is long standing, and broadly fine.
All noted
But the point is, if true is the framing used appropriate? The suggestion is that this is interest, but is it? And it was presented in a way that was opaque, to say the least
In that case is it fair accounting for and to an audience without your experience (and you had to ask questions to get to this)?
My suggestion is that it is framed inappropriately – and that is still wrong accounting in that case
Hi Richard,
On the framing, I’ll concede you may have a point here – that said, I think this kind of things happens a lot in accounting and statistics, the devil really is in the detail, and there can be a gap between how a concept is used by the author of a publication like public sector finances, and how it is understood by a casual reader, and of course how these figures are then reported by the media (who also don’t fully understand things).
There is also a trade off for the statistician between providing a detailed enough explanation of what’s happening and provided way too much detail that ends up hampering understanding and confusing folks.
On this particular issue, ONS do sort of set out an explanation of what is going on – I’m not sure I’d have been quite so sensational as they were in noting its a December record – but the rest of the text does an ok job of explaining the driver but maybe they should add a paragraph explaining in brief terms what government interest includes – and given they method they use, and the resulting variation, its probably better to point to quarterly or even annual interest numbers as a better guide to interest paid by government than noisier monthly data.
I will take this into account…..
… maybe I should just illustrate why I think the ONS method is “double counting.
Imagine I finance a debt with a 3% coupon bond issued at par (and market rates stay unchanged).
At the end of the year, the interest cost will be £3 and the outstanding debt £100.
Suppose I finance the debt with a Index Linked bond with a coupon of 1% and inflation hits target of 2%.
In round numbers, I would say the interest cost was £1 and the outstanding debt is now £102 (the inflation uplift). In short, I paid £2 less in interest but that has been added to the total amount owed.
Under ONS method (and correct me if I am wrong), they would say the interest cost was £1 plus the £2 uplift (ie. £3) but also that the amount owed is now £102…. ie a total of £5 worse off which is wrong.
Now, if the ONS record outstanding I/L debt at originally issued face value then they would avoid the double counting….. but this (to me) is clearly wrong because the uplifted amount is what has to be repaid so ought to be (and is, I believe) included in the outstanding debt amount.
You have to remember the ONS does not do double entry, which means normal controls do not apply to its reporting
I am researching this right now…..
Hi Richard,
Its not really correct to say that ONS doesn’t do double entry accounting, as it is generally doing this.
For instance, at issuance of a debt security all things being equal ONS will increase the stock of cash and the stock of debt at the same time. When interest accrues, this will be matched by an increase in the stock of debt (as the stock will be measured as the principal plus accrued but unpaid interest. When a coupon is paid ONS will record an interest expense and a reduction in cash.
In the cash of the uplift in principal due to the index linkage, ONS will record interest with a second entry increasing the stock of debt.
This is all pretty standard stuff in national accounting and government finance statistics (and in accounting)
Phil
National debt accounting is not double entry
It looks like that may be true here too
And given there is no one’s balance sheet to prove the movement there is a major accounting flaw in the way the ONS works
And then there is a dangerous mix of cash flow and accruals accounting here which reveals an inconsistency
But, let’s see
Richard
Hi Clive,
Thanks for the double count example, but your example isn’t quite right.
Lets extend the analysis a bit and look at a pair of 3 year bonds and what we record after 1 year.
The first bond is your 3% coupon bond, issued at par. Its issue price is 100, over the course of the year, we would accrue interest of 3%, and this would get recorded gradually, so if we look at monthly data we’d see a little bit of interest each month. Then at the end of the year and just before the coupon was paid, the debt would equal the initial principal of 100 and the accrued but unpaid interest of 3. The double entry recording for this is interest matched by an increase in the stock of debt. Then when you pay the coupon, you record a reduction in cash and a reduction in debt, so at the start of the 2nd year the opening stock of debt is once again 100 and we do the same thing again.
In each year, for our plain old coupon bond, we record interest of 3, which on a cash basis would be recorded when the coupon was paid, but on an accrual basis gets spread over the year. But the total interest is 9.
Now, what about our index linked bond? Here lets assume it is as you say, with 1% coupon and inflation is 2% each year. What do we record (simplifying a lot)? Well, the coupon accrues in the same way as the 3% coupon on our vanilla bond – spread over the year, added to the stock of debt, and then reduced as the coupon gets paid. But the principal uplift also gets recorded as interest, but as it only gets paid at redemption of the bond (i.e, at the end of year 3) that’s why the stock of debt gets bigger each year – but the total interest is the same. In this second case there’d still be interest of 9, but 3 comes as a result of the coupons, and the remaining 6 comes from the principal uplift.
So, in both cases the government receives 100 in cash, in both cases they ultimately pay 109 back to the creditor, in both cases there is 9 in interest, but while the stock of debt of the coupon bond has a sawtooth pattern going from 100 to 103 in each year as interest accrues and gets paid through the coupons, the index linked bond value goes from 100 to 103, then down to 102 (as you pay a coupon of 1) then up to 105, then down to 104 (as you pay the second year coupon, then up to 107 before you pay the final coupon and the index uplifted principal.
Hope all this is clear!
Thanks, we agree that (assuming 2% inflation) that the two are economically equivalent (give or take some minor timing issues). The issue is “how do we best display the data to illuminate rather than confuse?” If we use the IL coupon of 1% as “interest” we run the risk of giving the impression that debt is cheaper than it really is. Equally, if we include the inflation uplift we get pretty lumpy changes that don’t really tell us much (ie. has the cost of servicing our debt really tripled over the last year? I don’t think so.)
The challenge is to get the balance right without excessive “footnotes”.
I am going to have a think about it.
Footnotes are good
So too is appropriate framing….
I am also thinking about it
See my earlier comment about the different timescales between Government debt accounting, and the conventions of the accounting profession (which are conventions to reflect the timescales of a commetcial society). Some Government debt may be seen historically in a timeframe of centuries (actual redemption of an undated gilt – I know undated is no long used, but roll-overs can ebe endless without being acknoweldged). Cash flow accounting cuts through the time problem by the simple expedient of abolishing it. That is vital in the corporate world from a liquidity perspective; but whether this covers the real framework of government (which is not liquidity, but trust), is another matter. I suspect this is a problem because philosophically it has rarely been addressed.
I am now working on academic papers on this issue as well…
But these take time
Your point about the confusing presentation – which it has taken us most of today to try to untangle – is absolutely fair. You have to wonder if it is deliberate.
There are already newspaper articles out there saying the government paid a record amount of £8.1 billion in interest in December 2021. eg https://www.standard.co.uk/business/government-borrowing-december-rishi-sunak-inflation-tax-rises-b978508.html
If that sum includes £5.5bn of premiums on redemption, which might not be payable for several years, or at all, that is plainly not correct. Who was that interest paid to?
At best it is wildly misleading. Sure, there is an increase in a financial liability, which should be taken into account as a finance cost, but not (it seems to me) as an interest payment. But you are the accountant in the room!
My question is, is this cash flow accounting, or not?
Which is it to be?
2 Really thick/basic Qs please:
1. Why does UK govt have to buy index linked gilts when it can print money?
2. What is the best introductory book on this whole area?
Thank you!
Try The Deficit Myth by Stephanie Kelton
I doubt you thought this blog item would generate so much traffic! But, the level of traffic illustrates the misleading nature of the “raw” number. We have managed to work out what the number means but in my view it fails to do its job. Data is supposed to enlighten us but the very fact we see “interest costs surge” headlines shows that (possibly deliberately) the data is being used to mislead.
Perhaps we need to propose a better way of doing things to the ONS? What would it look like? Let me post a further reply tomorrow!
I think it’s been reAlly worthwhile
Post more
I will be writing to the ONS, maybe tomorrow, seeking answers
One thing I’d just say is that while this December number has generated headlines (I think due to the way ONS, perhaps unwisely, noted that this was a record number for December), the monthly interest data is pretty volatile, surprisingly so at first glance, but I think almost entirely due to the index linked bonds – and I think explaining this is aspect of UK debt and interest payments (which isn’t very intuitive) is where ONS could do better.
But I don’t think ONS are wrong in what they are doing here, nor do I really agree that the number is “misleading”, especially given the ONS did provide some reasonably clear context on this, so if and when you do write to them, I think a constructive approach would be to point out the way this was reported, and then note the impact of the index linked bonds and suggest they provide some additional explanations of how to understand and use this data.
That will be the approach
Plus bigger framing issues
Are you able to summarise your conclusions in a nontechnical way please?
Later….
So, if we don’t like the way the ONS accounts for the National Debt. What should it do? There will be lots of views out there but here are my thoughts.
First, I am going to park the issue of what to do with the APF portfolio – I have my views and they broadly align with Richard but I know that this is controversial and I want to get a consensus that is acceptable across the board.
Second, I am going to ignore non-gilt debt. It’s opaque … but small enough to not matter much. I will go with their current treatment (even though I don’t know what it is!)
Third, the data is a statement of what has already happened… but we are always angling to know what it means for the future. We should, where we can, display data in a way that we can intuitively use it to predict the future.
My suggestion is
(a) Use Market Value of outstanding gilts; (price plus accrued interest multiplied by face amount outstanding). Intuitively this is a useful as it answers the question “how much would it cost to pay off the debt today”.
(b) Define Interest is as coupons paid during the period in question less any change in accrued interest. (don’t get confused by “change in accrued interest” – this just “smooths” the “chunky” semi annual interest payments over the year). Given the long duration of the gilt portfolio in issuance this should be a fairly stable number that can be projected forward (with tweaks for deficit and interest rate forecasts) by those that wish to. Indeed, the ONS could provide some standardised projections.
This is simple but we do need to pick out a few more details and this can all be done by clearly breaking down the reasons for the change in market value of the gilt portfolio in issuance.
The possible reasons are
1. Market value of new gilts sold less face value of maturing gilts. Give or take Government cash balances, this is the budget deficit. Clearly important.
2. Change in market value due to changes in market yields. As yields rise, the market value of the debt will fall (all other things being equal). This can cause some folk a problem “rising interest rates is bad for government finances surely it can’t be right that the size of the debt falls?”… but no one is suggesting that the size of the debt today is saying anything about future debt service costs.
3. Change in market value of the I/L gilt portfolio due to inflation uplift. This is stating explicitly the “payback” for the lower interest payments associated with I/L gilts. Indeed, one could project what the number is going to be under various inflation forecasts.
4. Change in government cash balances. Perhaps we should net off cash balances up front but if not then they should appear here. If not, a massive new gilt issue would appear as a leap in debt which would be odd if the cash raised was still just sitting in the BoE. There needs to be some netting.
What do people think? What else should be included?
Clive
I have been trying to write a response all day and felt too unwell
I will get back to you
Richard
Get well.
FWIW I had terrible toothache shortly before a long sailing trip two years ago. I had it pulled…. and no regrets!
First they say I need the infection to go down…
But this is on my list
And I note your advice and I still have all the rest
Mr Parry,
I note that you exclude Treasury Bills, (TBs) presumably because they account for a small proportion of the total. Under the ‘full funding rule’ there appears to be three elements in Dent, however; Gilts, TBs – and NS&I. A quick trawl of the NS&I Annual Report suggested to me that the total NS&I stock in 2021 is £203Bn; add TBs of around £60Bn, and the total of circa £260Bn seems to me to be material.
Correct, NS&I should be included.
Bills are slightly more complicated. It is a relatively small number but still deserves attention.
If one looks at the data on an annual basis all bills in issue at the start would have matured… and then been refinanced. Also, as discount instruments they carry no explicit rate of interest ( they are sold at a price below 100% of face value and payback at 100 with the capital gain acting as “interest”)
One way to deal with them would be to exclude them from “interest” data and just state the market value of bills in issue and the change in market value of bills (which, given their short maturity will be roughly equal to extra new issuance). I think this would be my preferred way.
Alternatively, over any period you could go through every weekly bill auction, collect the issue price and subtract this from 100 (or, if not matured, either Market Value or an amortised value) and use this as “interest”. But this is fiddly and not very illuminating.
I take the view that “interest is interest”… everything else should be wrapped up in “change in MV of outstanding debt” along with 5 or 6 footnotes that explain why the changes.
It tells us all we need to know in a “neutral” way.
I am now working on this…
“If one looks at the data on an annual basis all bills in issue at the start would have matured… and then been refinanced.”
Here is an example of the issue of the quite different time-frames being disguised by the annual cycle being treated as the crucial one. The Government time-frame for the National Debt is centuries. You cannot square that circle. They do not satisfactorily ‘square’. Refinancing (of roll-over, or consolidation), is just a method that completely defeats the purpose of a set of accounts based on an ‘annual’ time-frame, when one year is an ephemeral, transient almost meaningless snapshot moment in the money and debt cycle of government.
I have to disagree John
For a start, you are assuming this is debt
It isn’t. It’s equity
That is how to take the time dimension out of this
Name it is permanent
Sorry Richard, I do not think a nominalist solution fixes the problem; I described it as ‘debt’ only because that is the convention (and the convention is that the government always sets it up to look, sound and act like a debt). It is in essence a Government cast-iron promise to pay; and the Government will always pay, no matter what; because that is what sustains trust in the system.
I am simply looking for a methodology that strips out the anomalies that are tying everyone in knots about metaphysical questions of when interest isn’t interest, and when it arises or doesn’t arise, from the perspectives of an annual cycle, against a redemption some time in an unfoecastable future. This looks to me like the problem of a two-dimensional being, living in a three-dimensional world. The extra dimension here is time; and in the case of inflation, or market price of a Gilt in any given year, and the perspective post-redemption, they are really quite phenomena that cannot neatly be reconciled or explained away. What we require is a presentation that can in some way present the contextual framwork of two quite different masters. The simplest solution is not footnotes, but to set out two (or more?) perspectives, viewed from the different time-frames, so as to being out both the complexity, and that short-term perspectives are often ephemeral and misleading.
Discounting then….no thanks….
I have written to the ONS today
“…. they are really quite different phenomena that cannot neatly be reconciled or explained away.”
There is a curiosity in the case of NS&I Premium Bonds. It is possible for investors automatically to reinvest their winnings (prizes). The prizes are effectively the interest (I think currently <1%). But are reinvested prizes interest or new bonds? They will quickly become new bonds, but are they recoded as interest? In what sense are they 'paid' if the holder receives no payment, except as a new bond? I do not know how material this element of automatic reinvestment by bondholders may be. Perhaps I am missing something …. perhaps the esotericism of all this is 'getting to me'!
(I think I can hear some wise commenters, and a blogger I can think of now murmurming …. long ago John, long ago).
I am still trying to write the material on all this..maybe next week
Congratulations on the article,, which meets a pressing need. The whole is heavy for most non experts, including me and a non experts’ summary would be a handy addition to the debate.
Your way of dealing with the Elliott form of troll is excellent. Let them rant as a basis to conduct further argument and dump them when that ceases to be useful. I wonder whether making your reasons clear on the first response might serve two objectives? Firstly, allaying fears of your genuine readers that exchanges are political slanging matches (it could be so interpreted). Secondly, there have been suspected trolls who simply don’t think hard enough before posting and a comment from you might change their approach. Just a thought, anyway.
Given the wider political events it may seem odd to comment further on accounting issues…. but I will. Giving vent to my anger towards this government doesn’t really add anything but perhaps we can get a small win by persuading ONS to present the data in a better way.
As I have brooded on this I think my suggested treatment of conventional and I/L gilts makes sense. The capital uplift due to RPI is not in the market considered “interest”. Of course, it IS a cost and needs to be identified as such but this is best done as a part of “change in MV of debt outstanding”.
I am still pondering T-bills. In the market there is a distinction made between bills (less than one year, sometimes as short as 1 week) and bonds (always longer than 1 year at issue). There is a lot of seasonality of cash flows in/out of the Exchequer – eg. Tax payment deadlines will mean a sharp spike in government cash balances and that would typically lead to the BoE adding liquidity by buying bills or lending cash (taking gilts as collateral). Are the transactions on the BoE’s own account or on behalf of the Exchequer? It gets very complicated and does not really add to understanding.
My view is that cash balances and T-bills outstanding are recoded on the balance sheet along with the change in the outstandings. This can be very volatile but it does sort of keep the “noise/seasonality” away from underlying trends in debt levels and debt servicing costs.
Clive – I will mail you about this
Richard