Most of the data being used when discussing the economy is hopelessly incorrect. We even have up to six figures for the national debt in the UK – and all of them are wrong. It really is time for Rachel Reeves to start publishing decent data so we can have a proper economic debate in the UK.
This is longer than average and more complicated than average video and blog, but trust me, it's worth going through it.
This is the audio version:
This is the transcript:
Rachel Reeves has to get her numbers right.
I say that for good reason, because she hasn't. Simply, straightforwardly, a great deal of the data that is used to make decisions about the UK economy is what I might technically call CRAp. CRAp is an acronym that I created, and it stands for a ‘completely rubbish approximation' to the truth.
And I say that because, well - let's explore the information in this video.
Let's also highlight the fact that it is incredibly difficult to find the information that is very often talked about by journalists and economists and politicians and others because that data is buried deep within the national statistics.
For example, and I just use this as an example because it's really important, in the last month it has been reported that the UK's national debt. is equal to the UK's gross domestic product or national income. So, I went and had a look at the press release issued by the Office for National Statistics where this fact was trumpeted and I looked to see what the number in question was. And it wasn't there.
And then, I went to the Office for Budget Responsibility and had a look at their data on what that figure was. They publish a review every month of this financial information published by the Office for National Statistics. And guess what? Neither of the figures for debt or the figure for GDP were there.
There were lots of percentage change figures. But if you wanted to find out just what the national debt was and what our Gross Domestic Product was, you wouldn't have found it from either of these sources from the information readily made available to the public. In fact, let me tell you how you find that information, because it's really important that you understand how difficult it is to get good data on debt.
To get it, you have to go to the Office for National Statistics figures for the public finances for the month. I'm using those for August here, by the way, because they're the most recent ones. And when you get there you can't use the web page in question.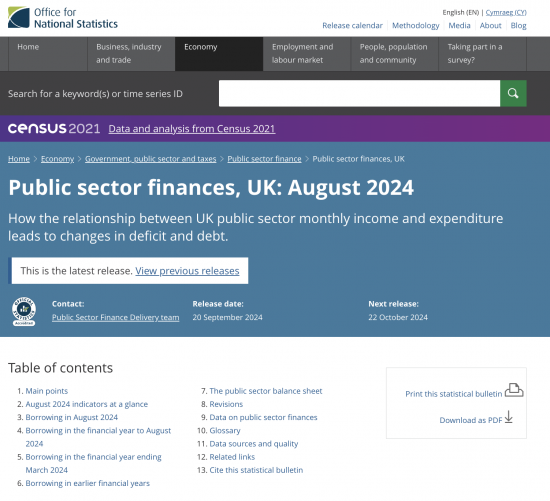
You have to follow the links to additional information on that web page, which are not very obvious. When you get to the web page for additional information, you will find there's quite a lot of it. You have to download Appendix A. You couldn't be sure that that was the case if you didn't know, but that's the table you have to get.
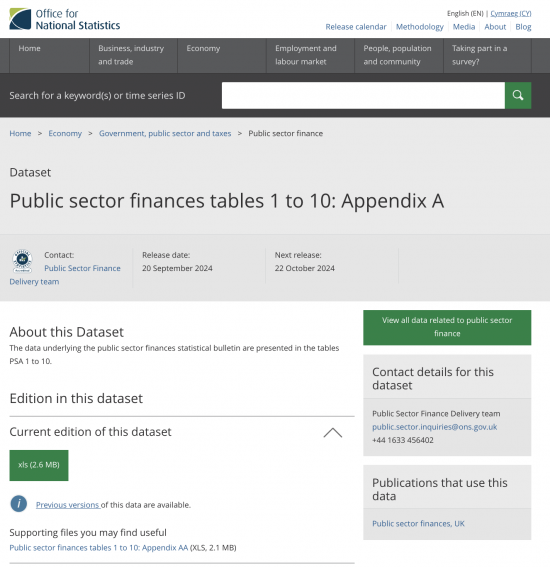
And it is a very large set of spreadsheets.
On that set of spreadsheets, you have to go to table PSA8B_2. Which is glaringly obvious, isn't it, unless you're a geek ,when you know that fact. And once you've got there, to find the figure for UK national debt which is used for the purposes of comparison with gross domestic product, you have to go to column C, line 497.
It isn't highlighted that that's the number you're looking for. There's nothing to tell you that this is the answer to the ultimate question; ‘what is the UK's national debt as per the discussions that go on in the public domain?' But that's where you'll find it.
That is totally unacceptable. You should not have to be a geek, like me, to know how to get that information. It should be trumpeted on the front of the ONS website. It should be published by the Office for Budget Responsibility in a very clear way in their written documentation, again, instead of being hidden inside spreadsheets that they produce.
This opacity makes sensible discussion of the national debt incredibly difficult, because even getting a figure for it, is very hard.
So let me actually now begin to explore what those numbers are using that data in Appendix A to the public finances that I've already explained exists. And if you go to that spreadsheet and you look at the range of data published broadly under the headings PSA8, with various extra letters and numbers added afterwards, you'll find there are no less than six figures for the national debt. I'm putting them up on the screen now. Look at them. There they go.
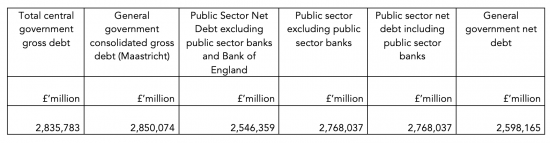
They vary, and I will reorganise them for the sake of clarity, between £2.85 trillion down to a bit over £2.5 trillion. That's a difference of £300 billion between the figures in question.
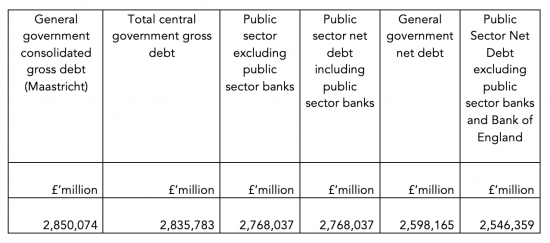
Do you now begin to see why I'm saying Rachel Reeves might need to get her figures right? Because there are six figures for the national debt, two of which, as you will notice, are now the same, but which weren't until a very few months ago, and all of them can be claimed to be right. Now, this is nonsense, because not only do we need to have a figure, but we need to have a correct figure. And none of those are even remotely close to the truth.
I should just do a little explanation of what the difference between the numbers is. I'm going to go back to that first table, because the figures on that first table flow in the way that they do through the government's calculations.
That first figure of £2,835 billion is made up of a number of other numbers, of course.
The first is the figure for UK government bonds in issue. There are £2,382 billion worth, supposedly, of these bonds in issue. We'll be coming back to that.
Then there are treasury bills in issue. These are just short-term bonds, by the way, for practical purposes. £112 billion of those.
And then there's National Savings and Investments. Yes, Premium Bonds are part of the national debt, and so is any money that you might save with NS&I. How much is there? £232 billion.
And then there's various other bits and pieces, we won't go into the detail, that come to £109 billion. And so we get to £2,835 billion of debt.
The next figure is the version which is on the EU basis of calculation. It's very close as you'll see, £2,850 billion, so we won't worry about the difference.
So, having dismissed the EU's version, let's look at the next figure. That figure is for the public sector net debt, excluding public sector banks and the Bank of England. This figure is £2,546 billion, therefore almost £300bn short again of what we are on the first number.
This figure effectively brings into account £289 billion of cash and other very short-term financial assets that the government owns. In other words, it says that parts of the sums deposited with the government - and regular viewers of this channel will know that I think that all national debt is simply savings with the government - is represented by cash held by the government. And some of that is undoubtedly in NS& I. £289 billion pounds of that is taken off the total figure for debt to come to this figure of £2, 546 billion.
But then suddenly in the next column you'll see that the public sector excluding public sector banks figure goes up significantly and is now £2,768 billion.
Why the increase? That's because it is claimed that the Bank of England contributes to the national debt. How much does it contribute? Roughly £222bn, overall, at this period.
Can you find that figure on the Bank of England's own balance sheet? Is there such a liability owing by the Bank of England to anyone who can be identified? The answer is no. It's quite straightforwardly, no. There is no such figure in existence, and no one is owed this money.
So why do we add in £220 plus billion of debt, apparently owed by the Bank of England, which doesn't exist? That's because the Office for National Statistics claim that there is a potential loss on the sale of the bonds which are owned by the Bank of England as a consequence of the QE processes undertaken since 2009. And that potential loss is represented by this supposed liability.
It's a made-up number. Those bonds don't need to be sold. If they were held to the time that they were redeemed, the figure would be nothing like as big as this. But they claim that this loss exists. And therefore, they add it into their national debt because they want to come to the biggest number they can think possible.
Because of the ways in which the public sector banks, this was, once upon a time, all those banks like Northern Rock and NatWest and Lloyds and RBS and everything else that were owned by the state, have now been moved off the balance sheet, the figures including and excluding public sector banks have very recently become the same, as you will see.
But there is still a final figure left over, which is general government net debt. And what is that figure? Well, that figure takes into account the fact that the government does hold a £179 billion pounds of foreign currency reserves which, are of course, assets. And, therefore, it brings them into account and brings the figure for net debt down because, well, if we did have a claim against the UK for repayable debt, these assets could be used to pay it.
The trouble is, having explained all those numbers and explained that the figures are £300 billion different, which is the true number? Well, according to the Office for National Statistics, it is the public sector, excluding public sector banks. That's £2,768 billion.
Well, there you go. Now, does that mean the figure is right? I'm afraid to say it doesn't, because at this point I'm going to introduce you to a completely different statement of the national debt. The UK government does actually publish a set of accounts for itself. A set of accounts that look remarkably like those for a business or a very large company.
Now they are incredibly behind with the publication of these accounts. The most recent that are available are to March 2022, which is not a measure of confidence in the government's ability to prepare accounts. If they were a large company, they would have basically ceased to exist by now. There would have been a winding-up order brought against them. They would have been told to stop trading because their accounts were so overdue.
Frankly, if they were a small company, the Revenue would by now be taking them to cleaners for tax due on the basis of non-declaration of income for the purposes of taxation. But the government can apparently get away with not publishing its accounts for two and a half years, and nobody seems to worry. The 2023 figures should have been out ages ago.
We only got those for 2022 in March 2024. So we'll have to use the 2022 figures because there's nothing else available to us. Now the first thing I'm going to put up are the assets that are shown on the government's own accounts, and, as you'll see there, the total assets owned by the government amount to £2,414 billion.
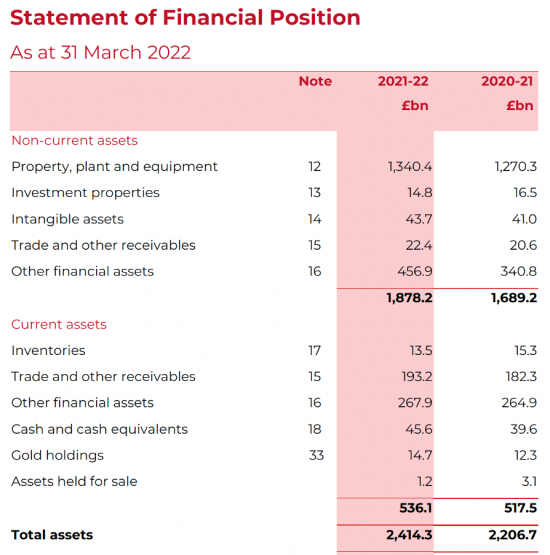
Compare that to the figure for the national debt of £2,768 billion. And the national debt becomes not a lot really, doesn't it?
In practice, there are assets that represent most of the money that we've borrowed. Some of those assets are things like property, plant and equipment, hospitals, roads, schools, all sorts of things like that: £1,340 billion worth.
Some of those assets are financial assets. And we've referred to some of those, foreign reserves and cash holdings. Those things are all assets. But the government refuses to recognise them. when recognising whether it has debt or not.
It also has a very odd position when it comes to publishing its liabilities. Look at the figures in here.
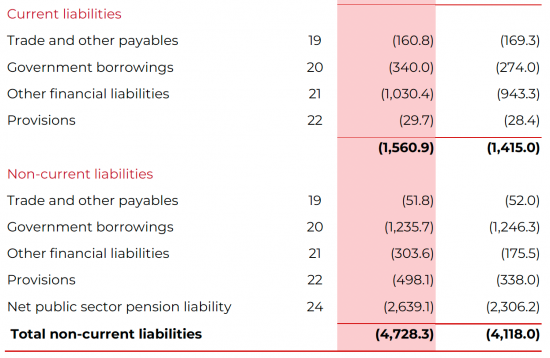
For total liabilities, apparently they are £4,728 billion. That would of course wipe out the net position that we've got on the assets and turn the overall situation into liabilities, which is what the government wants to represent.
But before we jump to the conclusion that that is correct, I want to draw your attention to some numbers. In particular, I want to look at the figure for government borrowing, because, if we put that figure up, it is a total of £1,575 billion at this time.
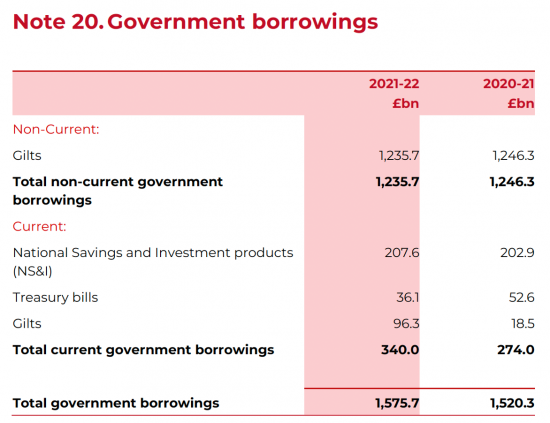
Now, that's really confusing because, at the time in question, the UK government said on those spreadsheets that we've already been talking about that the UK government debt was much higher than that. In fact, if we look at the total figure for government bonds owing on this balance sheet, which was audited and is therefore considered to be in accounting terms, correct, the total comes to, well, just over £1,340 billion. But according to the government, at the time, on the Office for National Statistics, the true figure was £2,004 billion.
The difference is obviously coming on for £670 billion. How can we get the figure for the gilts in issue, the bonds in issue, so wrong? Well, the answer is found in another number, which is to be found on that balance sheet. And I'm rounding the number slightly because if we went into absolute detail, it would become impossible.
But if we go back to look at the overall figures for the liabilities of the government, you'll see there's a figure called other financial liabilities. And those are for the current liabilities, and they're what matters in this context, those figures are made up of two numbers. £951 billion at the time was cash on deposit with the Bank of England. Most of the rest was banknotes in issue. In other words, just over £1,000 billion represents money created by the government.
Now, is that a liability earned by the government? Because if it tried to repay it, it would have to repay it by creating more money. And what would happen if it paid the banks who hold this money, because all these sums are held by commercial banks with the Bank of England - they're the only people who are allowed to have deposit accounts with the Bank of England. If the Bank of England tried to repay those deposits to those banks, those banks would basically have to immediately re-deposit the money with the Bank of England.
In fact, technically, these banks can't ask for repayment as a group. Each bank in question can change the figure on its own account with the Bank of England. But in aggregate, they can't. These figures are fixed in total, except by choice of the government. So, that £1,030billion; is it really a liability owing? Or is it just money in creation?
And is that money in creation really the equivalent, in accounting terms, of the equity owned by the people of this country? We have a share in that money supply, in effect. My argument is that it is. In other words, this isn't a liability at all.
And there's another figure on these accounts which I'd also say isn't a liability at all, and that's the net public sector pension liability, which is stated to be £2,639 billion.
That's the pension payable to nurses and civil servants and the armed forces and a whole range of other people, excluding people who work for local government, who do actually have a funded pension fund, and university lecturers who are also in that position, and I'm a member of that fund. Those people do have pension funds, but the vast majority of civil servants and public employees don't.
So, their pensions will be paid out of future taxation. That is shown as a liability. But is it? It would be if the government was a company, and for some bizarre reason, it uses the rules of company accounting to prepare its accounts of the sort we're looking at here. But it isn't a company. It's nothing like a company.
A company cannot require you by law to return to keep buying from it. Therefore, a company, if it has a bill for something in the past, can't rely on having any future income to match it with. And, therefore, it has to record it now on its balance sheet. But the government is nothing like a company because, as we all know, the government is going to tax us in future. And as we all know, all these pensions have always been paid out of taxation in the past, and the world has not fallen apart as a result. So, they will be paid out of taxation in the future and legally, we're going to have to pay it. So, for these accounts to be properly stated, given the situation of the government, the future income stream that the government can demand to cover this liability should have been included in the accounts as well, or alternatively, there is no liability at all. In accounting terms, that figure of £2,639 billion is, then, nonsense.
In other words, over £3,600 billion of the total liabilities shown on these accounts is either money in existence, which the government has created for us to use and therefore is not something that needs to be repaid, or is a liability which we know will be paid out of future taxation and which doesn't therefore need to be taken into account now.
What I'm trying to say as a result is that the claim that we actually have anything like the scale of liabilities in existence that the government says here.
If we take the total assets that the government owns according to these accounts of over £2,400 billion and then take off that the true liabilities excluding those pension funds which will be covered by future taxation and excluding the money which we can't repay without creating more money, then we come down to a net situation where the total liabilities are actually, total assets because £2,400 billion less liabilities, which are running at only about £1,100 billion comes to a positive number of about £1,300 billion.
That's the true figure for our national debt. We don't have a debt crisis. We have a positive surplus of assets in this country.
So why does the government talk about the fact that we owe £2,768 billion, that number we saw a long time ago in this video?
Because it wants to stop itself spending by frightening itself about the scale of the debt as if the debt is going to crush us all.
As I've just shown, it isn't.
We don't have a debt crisis in the UK.
We do have a problem with some very bad numbers.
We do have a problem with some very bad comprehension of what makes up those numbers.
We do have a problem of communication because the Treasury keeps on insisting that we are in enormous quantities of debt that don't exist.
We do have a problem that the reality of money creation throughout the QE process has been ignored in the statement of the national debt.
We do, therefore, have a problem with falsehoods being presented as if they are fact.
But what we don't have is a problem with national debt. Because overall, we're in quite a good financial position. We've got strong assets. We have the ability to make money. We have the ability to raise taxation in the future. And when it comes down to it, we do as a result, Have a net surplus of assets on the national accounts.
Let's stop fussing, Rachel Reeves.
Rachel Reeves, please understand this data. If only you did proper accounting; if only you got your accounts up to date, we wouldn't be in the mess we're in.
It's time you got your numbers right, Rachel.
Thanks for reading this post.
You can share this post on social media of your choice by clicking these icons:
There are links to this blog's glossary in the above post that explain technical terms used in it. Follow them for more explanations.
You can subscribe to this blog's daily email here.
And if you would like to support this blog you can, here:

 Buy me a coffee!

May I suggest that The National Debt is the figure a Politician wants it to be?
It should in principle be possible to measure the UK’s public sector debt. As you outline there are unresolved and usually unexplored problems of definition.
But at best GDP is an atrocious guesstimate. Not least because 10% of it is imaginary rent paid by owner occupiers. Yet the ONS claims to know it within a fraction of a percentage point.
So we have Reeves using her self imposed “fiscal rules” to compare one poorly defined number with an imaginary number to nudge up or down policy positions on measures costing tens or hundreds of millions of pounds, in the context of total public expenditure of over one trillion (a thousand billion – so ten billion is less than one percent) where £100m is less than a hundredth of one percent.
It is a confidence trick. But it has real consequences.
Agreed
If you tell the government that we have a net surplus of assets, then they will sell them off, and they’ll find a way to funnel the proceeds into private hands.
It would be nice to know what the country’s total assets were, before many of them were sold. We know where the proceeds went, as we have more billionaires than ever before.
With the finance sector hovering – see Larry Elliott in the Guardian – none of this is about being honest – it is about just helping to justify the unacceptable and bowing to the financial sector’s leverage, also reported in the Guardian today.
As ever it is TINA.
All of this is deliberate misinformation as far as I am concerned. It is not about getting it wrong at all.
While reading of the convoluted process to find ONS data, I was reminded of this from The Hitchhiker Guide to the Galaxy
“But the plans were on display…”
“On display? I eventually had to go down to the cellar to find them.”
“That’s the display department.”
“With a flashlight.”
“Ah, well, the lights had probably gone.”
“So had the stairs.”
“But look, you found the notice, didn’t you?”
“Yes,” said Arthur, “yes I did. It was on display in the bottom of a locked filing cabinet stuck in a disused lavatory with a sign on the door saying ‘Beware of the Leopard”
That’s about it.
Keith Slater, I would “like” your comment, but at this moment in time it has 42 likes and I feel it would be a shame to change that.
Have I got this right?
If I buy a Premium Bond, I am increasing Government Debt, and thus adding to RR’s mysterious black hole
Yes
That’s right
Absurd, isn’t it?
Whew I need another cup of tea now!! Very comprehensive but commentators and politicians are unlikely to read it. I also think the current government would ignore it as it means all their statements and policies are completely wrong. Regarding commentators – the fact that BBC presenters and journalists generally lack the ability to look at these issues means they will remain hidden from view. They will simply repeat the mantra ‘We have too much debt’. The BBC also has too many city economic people on its programmes so gets a distorted view of the economy and debt issues.
These ones are foundational statemwents – they can be built on and fromn
Thanks for watching
Always good to expand knowledge!
Rather than Blogging on this, I wonder if you should not sit down with, friends/colleagues, say Prem Sikka and Danny Blanchflower and submit an academic version of this analysis to a rated Economic Journal. It is an illuminating challenge to the methodology of ONS, OBR which in turn is a very bad product of the dysfunctional economic mainstream.
John
As you will see this morning, I am by and large giving up academia now. Why? Because I don’t think it can deliver the change we need – and is stacked against it happening.
Richard
I’ve been posting in the Times comments, saying that Reeves’ missing £22 billion is about 2% of the total tax take, and most people doing a budget forecast would be amazed if the results were within 2% of the forecast. No-one notices; people just don’t want to know. They prefer to believe what politicians say. Why?
I wish I knew
And an excellent point
@ Linda
There’s still a sense that economists who deal with numbers and formulae are part of the intelligentsia, and are not just con men with a gift for PR.
They even give some a faux Nobel Prize.
There is a sort of financial Stockbroker Syndrome whereby we trust the banksters, with the biggest and most convincing frauds perpetuated by middle aged white men in suits who wear old school ties, telling us its all for our own good.
As the market is lubricated, even turbo powered by ‘confidence’, then what chance do we stand against the Bankster of Oz ?
This all brings to mind those weird fairground ‘attractions’ of old – the hall of mirrors – in which one could laugh at oneself (and more, companions) seeing reflections in distorting mirrors; making the thin, fat; the tall, short; oddly-bulging waistlines or over-extended necks and huge ears etc… NOT the place to go to decide ‘do I look fat in this?’; still less, to know whether there is any reason to be concerned about obesity or anorexia.
“A false balance is an abomination to the Lord, but an accurate weight is his delight.” Proverbs 11:1
After all these intricacies , is there any realistic way of calculating the % of national debt compared with GDP and if so is a % target for the government to aim for ie national debt down to less that 100% of GDP or is the whole thing an utter farce and complete muddle and confusion?
Not realistically….
Hi Richard, good article.
You say that each individual bank can change the amount of reserve deposits it can hold with the BoE, but that the aggregate set by the govt is fixed. How does this work in practice? what if all banks want to increase their amount of reserves (may be because of favourable interest) who decides which banks can and can’t? is each bank only allowed to increase by a certain amount or a certain percentage? Aren’t reserve accounts essentially saving accounts for commercial banks? so it’s in their interest to have healthy reserve deposits?
The central bank reserve accounts (search them on tbis blog for a lot more reading) are the net value of money supply injected by the government into the economy. Tghe bnanks use these balances to make settlement with each other. That’s how funds get shifted between them. The aggregate balance is increased by the net of spending, taxes, bond issues and redemptions.
That is so telling – the ferretting you had to do to get the hidden headline figures from ONS and OBR .
With BBC presenters utterly incurious about all this – and happy to regurgitate ‘there is no money’ Reeves and co feel they can easily get away with it.
Maybe an innocent question of ‘from whom did we borrow the hundreds of billions to fund the pandemic furlough scheme?’ – might help to open all this in public debate.
Replying to the comment about the ‘furlough’ scheme. As a ‘beneficiary’ of a Bounce Back loan ( don’t worry, I am one of those who is still repaying it, albeit at 2% interest), I was amazed at the ease and speed with which it was obtained. And yes, the money did seem to come from nowhere? So why commentators never asked about the source of this largesse I could not understand.
A really tortuous story that, in my opinion, should never have needed to be told.
Thanks for all the time and effort this must have taken to unravel. It reinforces my view that, in the UK, anything remotely to do with government seems automatically to be shrouded so that the citizenry can be kept in the dark.
I clicked the ‘like’ symbol and the counter jumped from 15 to 37. Sorry about this, but I just did what I have done before. I have seen it jump by more than one a few times, but never such a large leap! However, all the extra counts are well-deserved.
Thanks
And YouTube only refreshes when you tell it to do so. A ‘like’ refreshes it, hence the jump.
Thanks again
The government continues to obscure the true nature of the National Debt. How is this lack of transparency acceptable in a democracy? Rachel Reeves says a black hole exists in the government’s finances, and UK citizens should take a word for it. There should be a public inquiry into the state of government finances. It is intolerable that the government can repeatedly and deliberately misinform its citizens about the actual fiscal situation. Worse still, it uses this misinformation to justify harmful austerity measures, effectively weaponizing economic policy against the very people it is meant to serve.
Thanks. I now need to wrap my head in a cold towel before it explodes!
In many cases it doesn’t really matter if the data is wrong – as long as it is consistently wrong. If it is consistently wrong “changes” will be reasonably well recorded…. and a lot of the time this is all we need. Eg. Is it getting hotter? can still answered if the thermometer is incorrectly calibrated…. and policies adopted accordingly. We don’t always need the detail.
However, there are occasions where this fails…. and this is one of them.
Two things leap out at me.
First, net public sector debt should be NET (because net is what we care about) – and, since the BoE is publicly owned, its holdings of gilts should be set off from the total. This did not matter 20 years ago but the advent of QE and, now, QT means it is important – particularly as it drives the policy of QT.
Second, If I borrow 3x my salary to buy a house I would not be thought of as reckless but my personal “debt/GDP” would be 300%. Why are we so worried about 100%? Of course, if I borrowed 3x my salary to party hard with nothing to show for it then I would be very reckless. That is why Debt/GDP ratios need a look at the asset side.
(I would add that “tax as a percentage of GDP”, a number oft quoted needs to be taken in the context of what we get for our taxes. Eg. In the US the number is lower but you have to pay for healthcare).
Much to agree with
“….nothing to show for it”.
This is a central question, but it is very, very hard to answer; because that always requires a quantifiable measurement of what is “shown”. We know that following Covid there are people who are sick, and therefore have removed themselves from the pool of employed. How do you measure investment to return people to health? Over what period? What does success look like? More important here, how do you measure it, not least the chain of circumstances of a return to health, and a measurable economic return (however that is identified).
Let me provide an illustration how difficult this is, even given the passage of a long period. Compare the proposition of “showing” to one of the more important major financial events in British history; the funding of slavery emancipation, in 1833. This was done by borrowing a vast sum, and paying the slave owners to free the slaves. The Government borrowed the money through a conventional bond, for 75% of the total. What did it receive for this? Precisely nothing. The output of the freed slaves did not materially change (indeed the conditions of the manumitted did not materially change; there was a non-negotiable apprenticeship, which was little different from slavery, didn’t work, ended early and the system largely returned to a quasi-slave business model). The slaves were not consulted and received nothing. The other 25% was not even borrowed by Government; the money was created, within another existing bond given to the slave owners (who cashed in the bond, miraculously at what must have been a guaranteed price). The government received nothing tangible.
What it actually achieved was to free Britain from a prevailing Slave Empire business model, and major slave owners now awash with cash they could invest elsewhere (typically not in indebted sugar plantations), but notably invest in British industrialisation (notably railway expansion in Britain). This remains a tangled story difficult to decipher (that historians have done a relatively poor job deciphering until recent years, and is still incomplete). Try turning that into “something to show for it”, while it is unfolding. Virtually impossibel – it isn’t going to happen.
Not once when reading railways history have I ever heard this mentioned
The best modern database on slave emancipation compensation is UCL (Legacies of British Slavery); but for a brief review specifically of the railway investment issue; given your interest in railways, I have turned to ‘London Reconnections’ (here: https://www.londonreconnections.com/2020/slavery-and-the-railways-part-1-acknowledging-the-past/#:~:text=In%20many%20cases%20individual%20compensation,a%20solid%20bet%20to%20many.)
Here is a relevant excerpt (I have not checked the analysis for accuracy, because I have not interrogated the database for that specific purpose):
“Around half of the slave owner compensation money paid out remained in the UK, despite only 3,000 of roughly 47,000 compensated slave owners living here, meaning that very wealthy individuals received huge payouts. In many cases individual compensation receipts reached the 1833 equivalent of tens of millions of pounds. These former slave owners needed somewhere to invest this money, and the embryonic but exciting new technology of railways naturally seemed like a solid bet to many.
The UCL database, which is being continually updated, currently includes 487 railway investments made by 175 slave-owning individuals accounting for £5,265,218 of capital”.
I did say the history researched and written, until relatively recently, has been woeful.
The £5.2m total accounts for over 25% of the total emancipation fund gifted (I choose the word carefully) to slave owners. Given only 175 individuals (if correct), is £35k each, on average. This can only be the largest (typically absentee) slave owners. Remember, the major asset of a slave plantation was not land, but slaves. A significant number (in political influence terms) of major recipients were MPs, or members of the house of Lords.
I think you arithmetic is out Clive.
You borrowing 3* salary to buy a house is equivalent to government borrowing about 1.3* GDP.
GDP is not government income, unless you think it all belongs to the government. So the denominator on the government side should be government income (about 44% of GDP) to mirror the denominator on your side where you’ve borrowed 3* your income.
The comaprison is actually utterly meaingless.
a) Government borrowing is no such thing – it is deposit taking. The comaprision is, then, a bank’s balance sheet if any comaparison is to be made.
b) The govermment controls the interest rate
c) The govermment also controls banks
Let’s end household analogies
Probably poor to use a “household” analogy…. but the key is “what I borrow for does matter”. And arbitrary Debt/GDP ratios are just that – arbitrary with no evidence (empirical or theoretical) to support any particular number.
Having said that, I think my “scale” is correct…. If I borrow 3x my salary it would take 3 years work to pay it off assuming I lived off fresh air). If, as a country, we borrowed 300% of GDP it would take 3 years to pay off the debt (again assuming we all live off fresh air).
Agreed
Britain has spent long periods historically, of its economically most successful periods with Debt/GDP ratios of 100%+; often closer to 150%-175%. The peak was 1945 (250%, roughly the same as Japan’s ratio today). The whole thing is specious nonsense.
The state is frightened it is challenged about something that matters; that the political elite do not want to do, because they do not represent “all of us in it together”; but very specific, closely related vested interests their whole ‘Raison d’être’ is to serve and protect. Government is somewhere between a cult, faction, clique, or sect – but if you aren’t a member, you are disposable election fodder.
Can you clarify the point about Premium Bonds? If I buy Premium Bonds, I would use money from my personal wealth (savings). I thought that was part of the National Debt, so buying the Premium Bonds just moves the debt from one category to another and leaves the total debt unchanged. Am I wrong on this?
This would also apply to Gilts. The money to buy them is already part of the National Debt and buying just moves that money from being available to spend to being locked up and effectively destroyed. If the Government decided to lower the National Debt by buying some of the Gilts, that would just put the debt back to being available for spending.
Your personal wealth is not part of the natiomnal debt unless saved with the government, when it is
And that does, indeed, make no sense
Have I got this right? We agonise over a ratio (Debt/GDP) of two numbers that nobody has much confidence in? Why?
Second, surely the only really important number from a government’s perspective, in respect of debt, is the cost of interest payments as a percentage of government spending. What level is this currently and at what level do you think it becomes a problem?
Question 1, correct
Question 2, higher than. normnal in real terms right now but less than 2%. What’s the issue then?
NB. It happened in 1833 because Parliament was populated, critically here among its most influential MPs by significant numbers of slave owners (especially large, absentee slave owners); for example only, the Gladstones.
Mt comment above should have been appended to my answer to Richard, regarding railway investment. Here, it is ‘out of sync’.
As I’m sure you will know John UCL did some research into the people who were paid in 1833. https://www.ucl.ac.uk/lbs/project/details
Les
Excellent revealing material with a nice tinge of humour to it. And frankly telling all that I & I guess many others have long-suspected. I have passed it on to everyone I know including Jamie Driscoll’s Majority campaign members.
Keep up the good work but don’t forget to chill out – otherwise you may well burn out. Take care & thanks for that video.
Thanks Alan
I have a lot of time for Jamie
Blimey I’m going to need to read that again. Les
Thanks
I spoke it without notes – just the charts
I’m delighted so many have given it so much time
A lot to take in and I will have to re-read a couple of times at least in order to absorb. Thank you for all your efforts.
So, if the Government wants to reduce its debt, why does NS&I even exist!
Good question
My wife is on her third reading….
I’m just amazed that anyone can get their head round all those figures – let alone take the immense trouble to ferret them out of the filing cabinet in the cellar.
Thank you for doing that.
And ’tis pity she won’t do it instead of swallowing the garbage fed to her by……who is feeding Rachel this CRap? The treasury presumably?….. or is it just pure prejudicial dogma?
Accountants ferret out numbers
“So, their pensions will be paid out of future taxation. ”
I thought that we are told, very definitely and insistently, that taxation DOES NOT PAY for government expenditure.
This is not the only recent occasion that taxation has been mentioned as Government income. It seems inconsistent to me.
The power to tax creates the value of money
Knowing that the power in question exists the government can commit to future spending, as it does on pensions, believing that the value will exist
Without tax in the future that power will not exist
I used shorthand
The argument is not undermined – but MMT does require soemthing more than a very simple undertsanding of what are complex issues, like how money gets its value now and in the future.