I had a quick check of some key food prices on international markets as a result of comments left on this blog with regard to inflation this morning.
This data comes from Trading Economics:

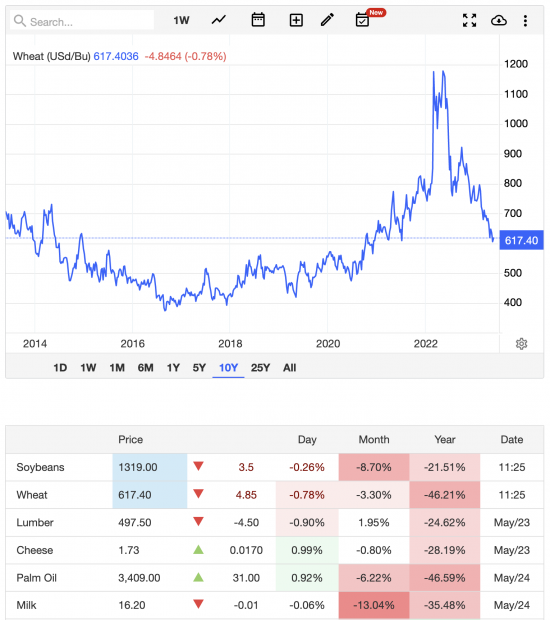
The chart is of US wheat prices. I stress that I do know that we use little US wheat, but wheat is traded globally, as are many of the commodities noted in the table at the bottom.
There is one absolutely consistent feature to be noted within that table. It is that some absolutely basic food prices are down heavily on international markets over the last year. The average fall in prices exceeds 20%.
Despite this, what we have learned today is that food prices in the UK are up 19% in a year, with bread, olive oil and milk being central to this, even though all of them have seen their bulk wholesale prices fall dramatically.
I am, of course, aware that food manufacturers buy forward. In other words, many of the raw materials that they are using at present were bought at higher prices set sometime in the last year. However, just as world oil and gas prices have now fallen significantly, so have food prices, and it is therefore entirely reasonable to expect three things.
The first is that the Bank of England takes this fact into account when appraising inflation expectations. If food prices are supposedly now driving inflation, then it is entirely reasonable to expect that inflation will fall significantly and soon precisely because of the decline in bulk food prices. Why is that possibility not being discussed?
Second, why aren't major retailers discussing this, and the implication that it will have on their own price structures over coming months?
Third, why is the emphasis only on those commodities where I accept that global prices have gone up, including sugar? Is there some sort of conspiracy to only discuss the bad news?
I think we need answers to those questions.
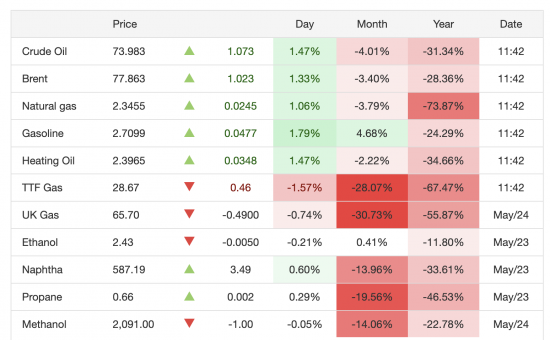
And before you say it, the answer is not down to energy costs. This table shows the movement in these over the last year:

Thanks for reading this post.
You can share this post on social media of your choice by clicking these icons:
You can subscribe to this blog's daily email here.
And if you would like to support this blog you can, here:


Why are supermarkets operating on such thin margins?
But I agree, based on your forward pricing, then yes, food prices should tumble and the BOE should be aware of this – surely?
And if interest rate ‘hikes’ take 18 months to work through the system, shouldn’t they pause while they take stock of what impact/damage is currently about to befall us?
Or are they using interest rate rises to ‘shock us’ into not spending?
All totally fair questions
I suspect increasing interest rates is to actually force you to work more. Funnily enough the economy is in the stinker.
I’ve worked in retail pricing with the supermarkets and others for around 20 years.
Most retailers did experience significant cost increases so will look to pass as much as that onto shoppers to maintain margin rates. Remember that when you see the TV adds looking for your loyalty.
The hope is that volumes don’t drop and part of that is guessing what competitors will do with prices. They breathe a sigh of relief when they also increase prices so they appear competitive in shelves.
There is a huge reluctance to drop prices. The pressure comes from consumers who vote with their basket and shop for own label products, discounters or go without.
Typically retailers will increase promotions to act as a smokescreen to promote ‘value’ which is seen through by most shoppers.
In this game either all retailers drop prices together (unlikely in this uncertain trading environment) or ramp up more deals. What will always happen is intense pressure on manufacturers cost prices and that will be happening right now
In other words, they’re screwing us?
The deals are increasing. You only have to look at the club card promotions that Tesco and sainsbury’s are doing.
My guess is that because people are buying own brands, they are getting neat from the brands.
Nectar prices at sainsburys has no own branded food included.
Clearly there is a reduction in food price but as the poster above mentions. They are passing this on through promotions.
One also might wonder why the buying forward point is more relevant to the UK than to other similar economies. Are we unique, or just more reliant on food imports?
Is the effect of energy prices, and the knock-on effect on food prices, more significant here for some reason?
I can’t see why…
We are food dependent, but those are world prices
Perhaps high prices are being maintained for political reasons so that the inflation caused by the belated implementation of the Brexit import controls in October and beyond can be quietly absorbed without drawing undue attention.
Is it possible that the BOE is using interest rates to prop up GDP via the housing market and thus providing succour to Brexiters?
The housing market dies not directly support GDP
House prices aren’t in GRP calculations
Trading Economics will also furnish you with food price inflation data by country in the EU and Europe.
It’s probably worth pointing out that the same elevated levels are evident there too.
Thanks
Delving into that American graph, the prices are shown with a contract date – July 2023!
You have to suspect that the basics on the shelves today were bought at settlements made 6 months ago.
I see no one has yet mentioned Brexit as a cause apart from Bill Kruse.
I think this might be contributing to food inflation as The Guardain points out:
https://www.theguardian.com/politics/2023/may/24/brexit-food-trade-barriers-have-cost-uk-households-7bn-report-finds
And as Bill points out, we still have the much delayed import controls required by Brexit which will keep prices nice and high as well as mean a lot of EU producers will give up exporting to the UK. Especially the smaller ones who often do the most interesting products.
I wonder how my favourite French deli will cope?
Thanks Brexiters!
It is undoubtedly an issue…
Rachel Reeves promised there was no way back in the USA this afternoon
She’s surely after the all-important brain-dead vote, and will change her tune once in power.
I can’t stand her, Bill. What about you? Unfortunately, she has provided no indication that she understands how the national currency system works, giving out the standard economic mainstream bollocks.
Reeves, Streeting, Cooper and Starmer scare me, frankly. It’s going to be tough surviving with that lot in power.
One of my all time favourite tweets, sorry don’t know who it was.
“Project fear
project near
project here
Oh dear”
People should remember that capitalism is not about efficiencies that benefit consumers, it is about making profit for shareholders, period.
I’ve been thinking about this and it’s pure Mirowski at work by the country’s supply chains and banking.
‘Never let a good crisis go to waste’ – that is THE Neo-lib mantra of our times. The aim is to exploit chaos for personal benefit.
Case bloody closed as far as I am concerned.
Absolutely agree. It’s no surprise that this is happening. What’s more, there’s no mechanism to stop it. Protest? Sign a petition? Write to your MP? Vote? The state is increasingly hostile, punitive and violent (e.g. anti union, anti protest, anti human rights), captured by
private interests (e.g. revolving doors, corporate funding, NHS privatisation) and withdrawing support (e.g. NHS underfunding, tuition fees), so the only option is increasingly for people to support each other directly, outside the system. I think things will become increasingly ugly. I’m not without hope, but a better world for many is by no means guaranteed. I imagine that it will have to be fought for, and the other side has all the resources.
[…] Food prices are falling dramatically on world markets. Why then is UK food price inflation running a…Richard Murphy, Funding the Future (was Ta Research UK). […]
Those retail prices are a ratchet — once up, they are never coming back down again. They may stabilize or plateau, but they’re never going to outright fall.
BREXIT