New data on wages out from the Office for National Statistics this morning suggests that:
- Growth in average total pay (including bonuses) and regular pay (excluding bonuses) among employees was the same at 6.4% in September to November 2022; for regular pay this is the strongest growth rate seen outside of the coronavirus (COVID-19) pandemic period.
- In September to November 2022, growth in real terms (adjusted for inflation) for total and regular pay both fell by 2.6% on the year; this is slightly smaller than the record fall in real regular pay we saw in April to June 2022 (3.0%), but still remains among the largest falls in growth since comparable records began in 2001.
- Average regular pay growth for the private sector was 7.2% in September to November 2022, and 3.3% for the public sector; outside of the height of the coronavirus pandemic period, this is the largest growth rate seen for the private sector.
- The finance and business services sector saw the largest regular growth rate at 7.6%, followed by the construction sector at 6.3%.
There are obvious points to note:
- Real wages are falling. It is impossible for the economy to grow in that situation: Sunak's promise that it will looks unlikely to be honoured.
- The situation for public sector workers is much worse than for private sector workers: that the public sector is where strike action is taking place is not hard ti understand.
- Finance, as ever, outperforms the rest of the economy whilst adding little value to it.
This chart results:
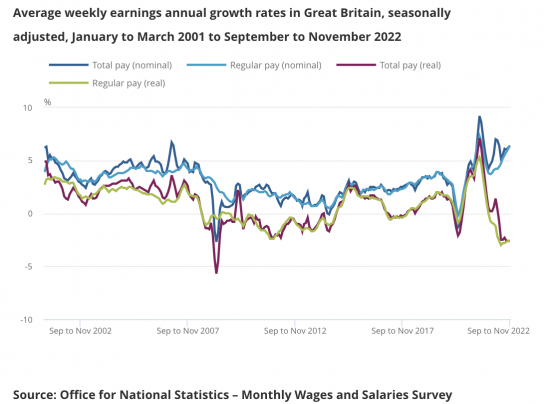
That is a far from happy picture.
And things could get worse. The news on jobs is:
- The number of vacancies in October to December 2022 was 1,161,000, which is a decrease of 75,000 from July to September 2022.
- Quarterly growth fell for the sixth consecutive period to negative 6.1% in October to December 2022, with vacancies falling in 14 out of 18 industry sectors.
- In October to December 2022, total vacancies were down by 85,000 from the level of a year ago, but remained 365,000 above their pre-coronavirus (COVID-19) January to March 2020 levels.
- In September to November 2022, the number of unemployed people per vacancy was at 1.0, which is up slightly from the previous quarter (June to August 2022) but remains indicative of a tight labour market.
The ONS might say there is a tight labour market: I read the data is suggesting that the economy is in decline and that those looking for work are going to struggle to find it.
2023 is not starting well, much as I expected.
Thanks for reading this post.
You can share this post on social media of your choice by clicking these icons:
There are links to this blog's glossary in the above post that explain technical terms used in it. Follow them for more explanations.
You can subscribe to this blog's daily email here.
And if you would like to support this blog you can, here:

 Buy me a coffee!

As a public sector employee I endorse the stats.
We continue to haemorrhage staff to the public sector undermining our ability to deliver. So our overpaid managers (one of the things we learnt from the private sector) just bear down on remaining staff.
I’m looking to get out myself but have noticed vacancies falling too which tells me that many employers have their eye on recession.
I think you comments are well founded.
Growth could come from domestic spending but that will decline as we spend more on energy and food. In real terms most have less to spend despite pay increases.
Jeremy Hunt has decreed tens of billions in spending cuts and tax rises “saying it prioritised “stability, growth and public services.”
The Govt. policy of Brexit has resulted in lower exports. So no boost there.
Of course, imported inflation and covid have been factors but this party of ‘economic competence’ has contributed to a failing economy.
How long can they stick to this boast? The Emperor has no clothes.
I must say that I do find this earnings data confusing. Using changes in changes of wage levels over overlapping periods gets very confusing very quickly…. particularly when some things lag/lead others. What might be most illuminating would be to take some fairly arbitrary point pre-pandemic (say, 1/1/2020 ?) and rebase wage and price data to this point (=100). I would also like to see two measures of inflation – the current one but also a “life’s basics” one to measure inflation as felt by lower earners. On wages we could then see public sector and private sector median wages.
For example, we might then see…(and I am making these numbers up)
General prices = 115
“Basics” prices = 120
Private sector wages = 110
Public sector wages = 105
This presentation of data might help us understand what is going on more clearly. Why does this matter? Well, we know inflation will fall sharply; wage data will lag and next year the government will say “Look! Wages are outstripping inflation. Let’s restrict public sector pay rises to the inflation rate”. This is also why the Unions are right to deal with pay now rather than allow things to drift.
The data is all there…. but it would take a lot of time to tease it out.
Moving to your substantive point….. yes, you are correct!
Good points
The basics issue is being addressed via a food index now, thanks to Jack Monroe, but it could be improved
The publication of such scales would add much-needed clarity to discussions about wage/price levels. It is staggeringly obvious that the current inflation is hitting the poorest hardest, but the ability to mismatch figures is cynically used by politicians to disguise this fact. It shouldn’t be left to Jack Monroe to be making a fuss about how much the current reporting hides the true impact on the lowest paid (although I whole-heartedly endorse her efforts). Seems to me that it ought to come from IFS or ONS.