This is a plot of UK net public debt from 1692 to 2020. Data is from here.
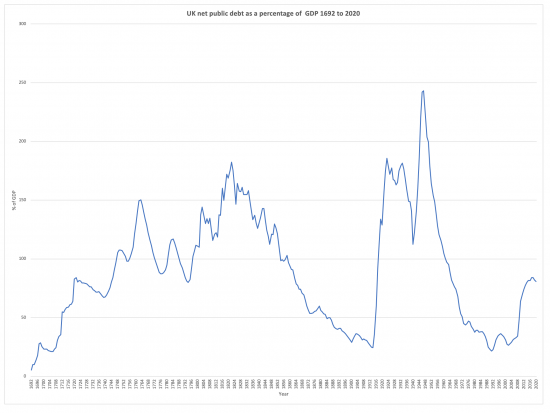 We're used to seeing plots from 1980 onwards. That always makes it look like where we are and where we are going is really worrying.
No, it is not: we can, have and will survive debt ratios vastly higher than we have now.
There is no need to panic. Such things are normal, especially during and after a crisis, and we do recover.
What we should, maybe, worry about is the fact that declining debt always seems to lead to crisis. But that's another issue.
Thanks for reading this post.
You can share this post on social media of your choice by clicking these icons:
There are links to this blog's glossary in the above post that explain technical terms used in it. Follow them for more explanations.
You can subscribe to this blog's daily email here.
And if you would like to support this blog you can, here:

 Buy me a coffee!

Is the image zoomable? It appears not on my browser at least
Click on it and you get the image by itself
Not working for me.
Sorry – what’s not working Ken?
Click the image and then click again on the next image if that does not work
I’m still getting no change when I left click (once or twice) on image. If I right click, I get the usual options (share, save, copy, paste, select all), but if I click on View Source it enlarges slightly, although not enough to make the years at the foot of the graph legible. N.B. I’ve got my glasses on! I wouldn’t fret about it as it’s not that important in the greater scheme of things since the trend is clear. It does make me wonder what the UKs finances would have looked like if it hadn’t waged war with such frequency
Good question….
Not working
Sorry – what’s not working?
[…] have already shown that there is nothing exceptional, odd or worrying about UK public debt now, and will not be even […]
Of course we have survived, and we will this time. The question is, at what cost, and what comes next.
Another way of looking at this might be to say, if net public debt rises to 150 to 200% of GDP, that this is an economic crisis on the scale of the Second or First World War, or the Napoleonic Wars, as those were last times net public debt levels rose like that. We got through those crises, and the economy and society recovered. What will things look like in one or two, or five, decades’ time?
Pretty good, based on those precedents
Assuming, of course, we do a Green New Deal
Ironically, from the perspective of employment and living standards, it was not the Napoleonic wars that caused unemployment and hardship, but the economic resession that followed the end of hostilities; compounded by the Corn Laws (1815) and serious political repression 1815-20 applied with brutal force against ordinary people already struggling against adversity.
As a P.S. to my response a minute or so ago, the browser I used was Microsoft Edge. I’ve now tried it on both Firefox and Google Chrome, but could get no response from either. Ho hum! Anyway you’ve got bigger fish to fry than this.
Regards,
Ken
Really sorry – it seems this routine that worked for years does not any more
I am completely baffled as well….
Sorry
I will try to work this out
Re seeing the tiny numbers: you can always “zoom in” your browser. That way you can see everything clearly.
Try this for the full-size image:
https://www.taxresearch.org.uk/Blog/wp-content/uploads/2020/05/Screenshot-2020-05-14-at-11.16.56.png
That graph is a prime example of the way governments can get the narrative they want by being selective in what information they give the population. Just cut it off at a convenient year and spin away!
Thanks for showing it to us; I had no idea that the UK had already survived and even thrived after running up much higher debt ratios.
Thanks…
I just don’t understand how there are any “accurate” figures for any century. The frauds – smuggling in or out of the country or “Empire” – tax evasion, incomplete data, crooked or incompetent admin in or out of government, regular wars and just plain wishful thinking and PR….perhaps I must attend the beginner’s class but that squiggly line does not compute in my brain.
If there are debt-holders – national or otherwise – I presume there are also credit-holders but who is the custodian of the reliable data ?
Too much lockdown for me perhaps
@ mike dun
The government is the debtor (= credit-holder, if you like), and its central records of how much debt it had issued at any date will have been and are accurate.
The GDP data are more contentious, but should be decent as far as broad trends are concerned.
So, take the ratios with a grain of salt, but not a bucket.