The FT has suggested this morning that the real cost of Brexit may be £340 million a week. I will be more honest: it is too hard to tell as yet. But, if it is measured by change in fortunes on growth this graph is telling:
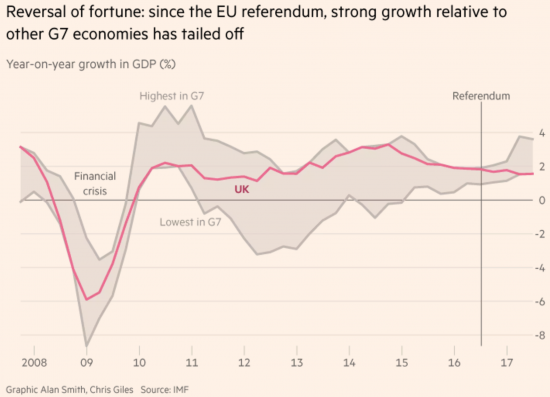
It is, admittedly, true that the UK did well from 2011 to 2016 precisely because it did so badly between 2008 and 2010, but the point that Chris Giles is making in the FT is that the change since the referendum has been quite marked. From being at the top of the G7 growth league it is now at the bottom, which is pretty much where everyone now forecasts it to stay. On this basis it is hard to disagree with the suggestion from Jonathan Portes that the UK has already lost at least 1% of its national income growth per annum as a consequence of Brexit.
I admit I was amongst those who expected this outcome. That does not mean that I derive much pleasure from it. And, stress, the worst is yet to come: Brexit has not happened yet.
Thanks for reading this post.
You can share this post on social media of your choice by clicking these icons:
There are links to this blog's glossary in the above post that explain technical terms used in it. Follow them for more explanations.
You can subscribe to this blog's daily email here.
And if you would like to support this blog you can, here:

 Buy me a coffee!

Consumer spending kept the economy growing immediately after the referendum when many predicted a recession. It looks however as if things are just limping along. Its also what I thought, anemic growth for the foreseeable future.
Which is why the government needs to call an end to fiscal austerity *right now*, as a matter of urgency.
Or move over, and make way for one which will.
Surely it’s far too soon to draw any meaningful conclusions. The increasingly short-term media reaction to and analysis of events is largely unhelpful, but probably intentional in order to create emotional responses, thus encouraging ‘confirmation bias’. Also simply to feed the obsession for 24/7 news.
We can draw provisional conclusions
And why not? We need them