I did some quick work on NHS A&E admissions data earlier this week. The data in question has been reworked by Sean Danaher, whose knowledge of maths and stats far exceeds mine. As Sean noted to me:
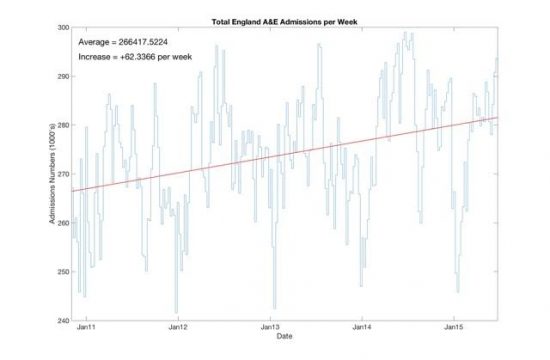
I've had a go at fitting the data. I've used fairly classical techniques to detrained the data (subtract best straight line and a Fourier Transform (up to 4th harmonic) to get the fit . There is quite a lot of variability but the headline figure is that the maximum on average is late July (24th). The minimum is in late January.
This is the trend:
And with regard to seasonality, the summer does show peak admissions:
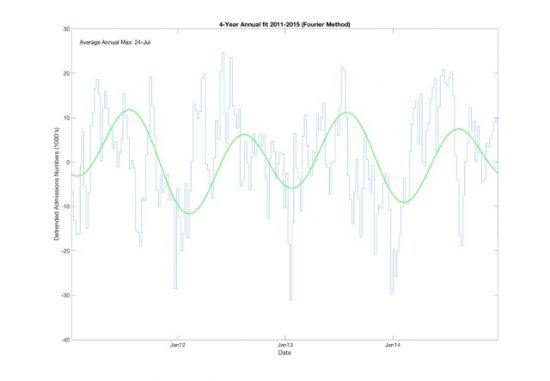
July is peak time, counter-intuitively.
My thanks to Sean.
Thanks for reading this post.
You can share this post on social media of your choice by clicking these icons:
There are links to this blog's glossary in the above post that explain technical terms used in it. Follow them for more explanations.
You can subscribe to this blog's daily email here.
And if you would like to support this blog you can, here:

 Buy me a coffee!

Hi Richard
sorry the correct technical term for removing the best straight line is “detrend”, I think my spell checker automatically changed it to “detrained”.
The analysis has been done in Matlab; which is also used extensively by economists and not just engineers and physicists. The code is available and if there is interest I will provide a link.
The conflict with intuition is so strong I think a theory needs to be proposed on why
People have fewer accidents when they are on the sofa watching TV, more accidents when active doing daft risky things.
A reminder again that this is attendances, not admissions. And of course one statistic does not tell the whole of a complex story.
The Kings Fund – https://www.kingsfund.org.uk/projects/urgent-emergency-care/urgent-and-emergency-care-mythbusters – discuss some reasons for A&E being busier in the winter, despite attendances (and admissions) being about 15% lower that the summer peak (about 49,000 attending each day, compared to 57,000 in the summer).
“during the winter months there is an increase in the proportion of older people attending and in the proportion of people who need to be admitted to a hospital bed as an emergency”
That is, the typical person attending in winter has a more serious issue to deal with, which takes more time and resources. As a result, they show the number of admissions (and the proportion of admissions) goes up a bit in the winter. That relatively small change has a dramatic impact on waiting times, particularly the small fraction of people waiting more then 4 hours. That suggests to me that the system is working close to capacity most of the time, so a small bump in demand can cause a significant problem.
That said, most of the time, approaching 95% of people are dealt with within 4 hours. At its worst, it rarely dips much below 90%. That 5% changes equates to a few thousand people every week.
Sorry, please ignore the “(and admissions)” parenthesis in the second paragraph – the next paragraph gets this right: winter admissions are a few percent higher (say, 80,000 per week, rather than 75,000).
But what this also says is that the problem is behind A&E
It is not A&E per se and a diversionary tactic is being used to blame those attending for something much more serious
And that was my real point
Thanks
Perhaps an apology is in order to Jeremy Hunt for calling him a liar regarding when A&E workload is busiest. For the staff on duty it is marginally the busiest period. Try sticking to policy criticism next time.
Then again part of the gig is in generating attention and false accusations achieve that goal.
The data supported what I said
I have no apology to make
So the archetypal summer attendee is the kid who has a saucepan stuck on their head, and the winter equivalent is a pensioner who’s had a fall and bust a hip?
(Oh and another question for Sean. It used to be said that there was a “werewolf” trend – A&E was always busiest close to the full moon. Does the data confirm/deny that?)
Having had a bit of experience of A&E wards my view is that if you are looking for an area to try to work out just what has been happening and what may happen, for predictive purposes, then this one is very difficult indeed. When managements and provision cannot see or understand anything beyond figures and putative predictions with too many variables then you are in trouble.
I am assured A&E is comprehensible – my wife has worked in them – but only if you really understand medical risk
A very valuable point from Andrew, well worth emphasising:
“That suggests to me that the system is working close to capacity most of the time, so a small bump in demand can cause a significant problem.”
This is true in all systems and, in safety-critical services, you budget for resilience – not just peak demand.
Operating a service at full capacity only makes financial sense if you can tolerate system failures – fragility – under foreseeable conditions as well as unforseen emergencies.
Agree with you both
The underlying point is: underfunding is dangerous long before it is obvious.
We’re back to queuing theory. Where when resource utilisation is high, as Andrew and Neil point out, small increases in utilisation cause big increases in queues. I know that some areas of the NHS have tried to analyse the utilisation of different resources using queuing theory, complex though it is given the resources involved and variety of treatments and service times. However, Im not sure it is widely understood and Id be surprised few if any in the DofH understand it
In my direct experience, very few people in the management consulting world understand it, and to accountants its positively counter intuitive (sorry Richard!). They are convinced that there is at worst a straight line relationship between how busy resources are and the impact on service times. Or at best, no relationship – just work harder…
Funny how the most obscure stuff you learn at university ends up being the most useful…
You only need to drive on motorways…..
There definitely seems to be an annual effect. The 4th harmonic (annual component) is easily the largest in the data; containing about 30% of the power spectral density. Doing mathematical analysis however does not however reveal much about the underlining hypothesis. Will discuss with the other half tonight who is a senior medic.
http://www.content.digital.nhs.uk/catalogue/PUB23070/acci-emer-atte-eng-2015-16-rep.pdf
Anybody who watched ‘Hospital’ on BBC2 yesterday couldn’t have failed to see this in action. There was a blockage in the queue, because there weren’t any spare ICU beds, so resources were wasted as surgical teams couldn’t start their ops. When an unforeseen admission occurred, the system broke down and queues backed up.
Another blockage occurs in my local hospital, because care packages can’t be obtained for patients ready for discharge. I looked up the hospital’s latest performance plan. Apparently, over 7% of beds on average are taken up by patients who could be cared for in the community. In a hospital with 1000 beds, that’s 70 patients.
The programme was good insight, I thought
Clearly busiest does not mean highest admissions, so it must mean resourcing and organisational problems in the larger system. Thus the chart makes sense. I wouldlove to see it as a Shewart Control Chart to see what the upper and lower control limits are and what the special causes may be – if any.
Clearly busiest does not mean highest attendances, so it must mean resourcing and organisational problems in the larger system. Thus the chart makes sense. I wouldlove to see it as a Shewart Control Chart to see what the upper and lower control limits are and what the special causes may be – if any.
(Why does your Fat Controller say I have already said this??)
I often ponder the future of our NHS, my opinion is we should focus on prevention rather than cure and technology will provide the answer. I foresee a time when we will quite accurately be able to monitor our own health and in many cases diagnose ourselves. I do hope technology does not provide a opening for more of our NHS to be brought in to private hands. I do believe that more and more of the service an A&E provides will be done at local health centres and this will be as a result of technological advancements. Look at what graphene appears to be capable of. Imagine the ability to test ourselves in the comfort of our own home on regular basis for the first signs of life threatening diseases.
I do believe there is also an argument for how we as individuals take care of our bodies, I truly despair the thought of treatment being refused for let’s say, your hugely overweight and the problems you have are a result of over eating, which is self inflicted so we will not be treating you.
We have to as a people become more responsible for ourselves own health, because Mark my words, if we don’t, evil capitalism will use this to divide us and end the NHS as we know it.
Most people arriving at a GP pactive now think they know what is wrong with them
And they’re wrong
Human paranoia is not going to change
Add to that the high rate of false positives when testing
What you are suggesting is vast over medicalisation