Tax avoidance is not as prevalent in the UK as most like to think.
When I last estimated it I put it at £19 billion - and there are those who would argue I was well wide of the mark, even if I would not agree. HMRC suggest the figure is only a quarter of that.
All parties in the election said they would raise money from tackling tax avoidance. I was pleased about that. The Conservatives now have the task of raising at least £5 billion a year by doing so.
Let's ignore for a moment the dubious methodology HMRC has used to justify its claim that it performs staggeringly well in this area - collecting more money than it ever admits is missing. Let's instead look at where any realistic measures to tackle tax avoidance will have to be focussed.
Start with income tax, which is the most avoided tax. Here the capacity to avoid has to be linked to the amount of income a person has. If there is no money left over at the end of the week there is rarely capacity for tax avoidance. To assess where this capacity exists I have restated the data in a table HMRC publish and which is often referred to. It looks like this:
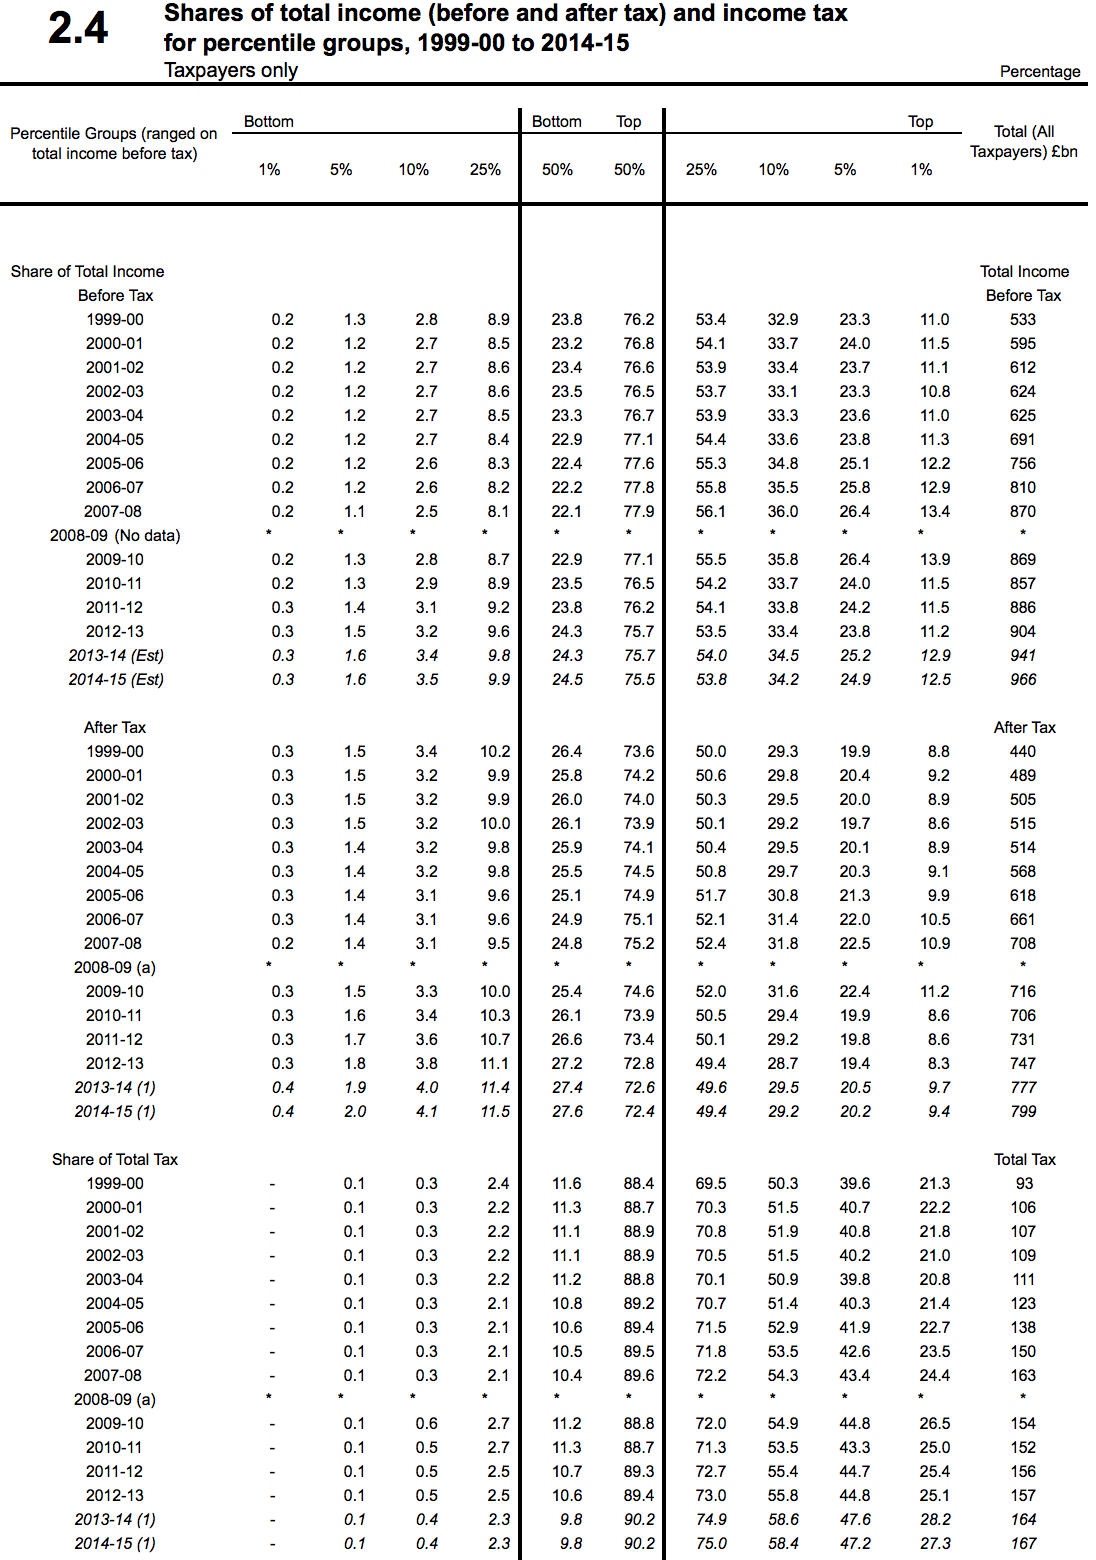
This is where the famous claim that the top 1% pay 27% of all tax comes from.
It is interesting that the revenue suggest that this fives rise to the following percentile points for income before tax:
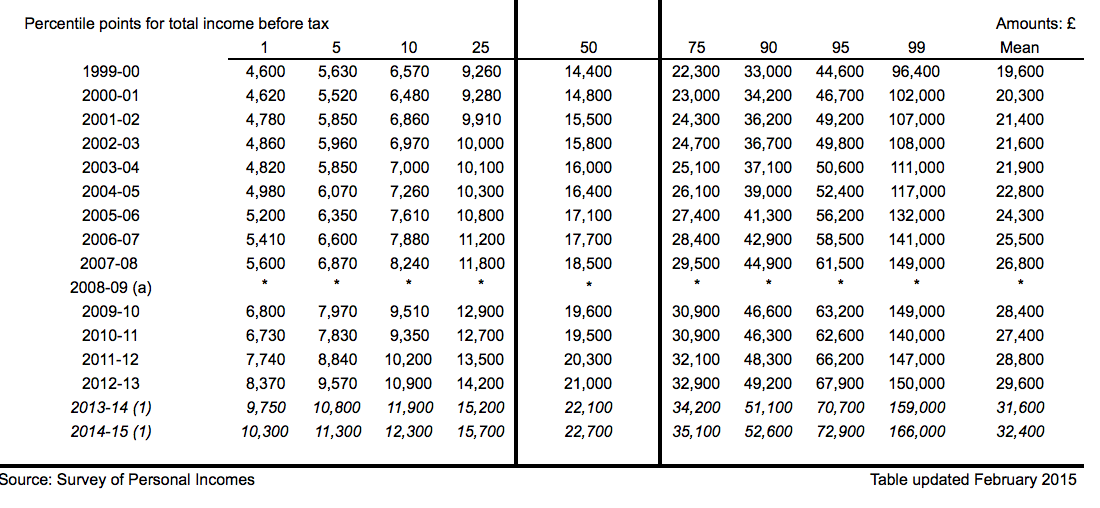
2013-14 and 2014-15 data is projected.
What is interesting is that HMRC choose to highlight the percentile points here. A percentile point is the value at which a part of the population are below the stated share of the percentile i..e it is not an average but is instead the lowest value in any band. So, the implication is accurate that those earning above £166,000 in 2014-15 may be in the top 1% of income earners, but that gives no indication as to why that group might pay 27% of total income tax as their average income is not stated.
So, using stated total taxable income for the year and the percentile band data and making all data discrete for each band, which HMRC's data is not, I have, using identical source information, restated the table in question as follows:
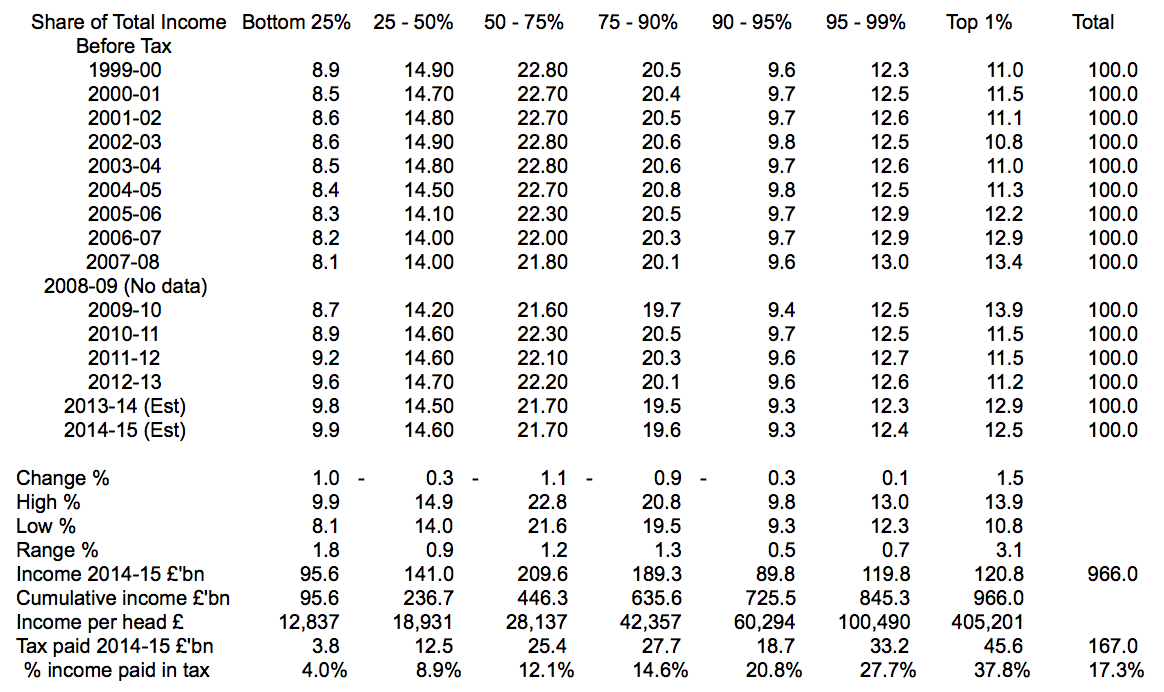 The key line is, perhaps, that for average income per head by band. Even in the third quartile (50 - 75%) average income is only £28,000 and this has only reached £60,000 in the 09-95%band.
In the 95 - 99% band it beats £100,000 but in the top 100% is four time higher at £405,000, on average.
In that case is it any surprise that this group pay say much tax?
But in that case measures against income tax avoidance will have to be targeted here.
How likely is that now, and if not, how likely is it that the £5 billion yield per annum will be achieved?
I am not an optimist.
Thanks for reading this post.
You can share this post on social media of your choice by clicking these icons:
There are links to this blog's glossary in the above post that explain technical terms used in it. Follow them for more explanations.
You can subscribe to this blog's daily email here.
And if you would like to support this blog you can, here:

 Buy me a coffee!

I would have thought the most avoided tax was VAT
Tiny avoidance of VAT
About £10 to £11 billion evaded
The very fact that the super rich pay27% of all income tax indicates how super rich they are. It’s not a statistic to prove they pay their way, it’s one that proves how unevenly wealth is distributed.