I have been musing on how and why H M Revenue & Customs might suggest that the 50p tax rate does not work and has only raised a few hundred million, not the £6.7 billion data published by HMRC last year implied.
Let me offer a cynical explanation that might do just that, and which would imply fraudulent manipulation of data by the Treasury. My data source is table 2.5 of HMRC's stats. This shows the number of people whose top income falls into various income brackets, one of which conveniently starts at £150,000. The estimates (and admittedly most of this data is estimated - although why is hard to tell - and indicates an appalling lack of analysis by HMRC) are as follows:
| Tax year | People earning over £150,000 | Total income of those earning over £150,000 | Average |
| £'m | £ | ||
| 2007-08 | 319,000 | 115,900 | 363,323 |
| 2008-09 | 320,000 | 116,500 | 364,063 |
| 2009-10 | 314,000 | 113,200 | 360,510 |
| 2010-11 | 328,000 | 112,200 | 342,073 |
| 2011-12 | 358,000 | 122,800 | 343,017 |
Notice that enormous jump in 2011/12? Isn't that odd? It is assumed that 9.1% more people come into this bracket that year, and earn 9.6% more as a result.
As I've shown, that data for 2011/12 implies total 50p tax rake of some £6.7 billion. The workings are here and in detail look like this:
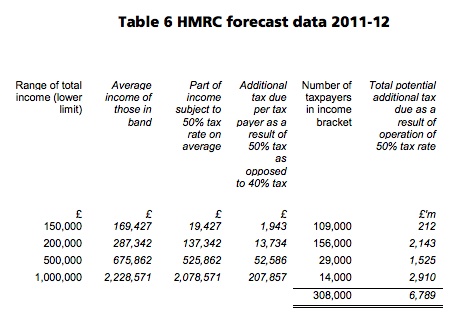
The number in the £150,000 bracket is smaller by the way because I've allowed for the fact that not all in this band actually pay tax at 50p etc due to pension contributions and so on.
But now let's suppose the Revenue's very odd forecast of significant growth in the number of very high earners - a trend that runs counter of course to experience across the economy as a whole - turns out to be wrong. Suppose that instead of this group growing by 30,000 in the year it hardly grew at all, as seems plausible. And their income did not grow by £10 billion in total as a result. What then?
Suddenly HMRC have a basis for forecasting that the 50p tax rate has resulted in a massive fall in the number of taxpayers paying at the top rate and that £10 billion of income fell out of tax as a result so that whilst the rate collected over £5 billion in all (as the 2010/11 data implies) the disincentive of the rate has cost about £5 billion (50% of £10 billi0on) and so as a consequence it net raised almost nothing at all.
That wouldn't be true at all though. It would in fact be a fabrication. It would not even be an elaborate fabrication. The forecast data for 2011/12 looks wrong the more I think about it: I just don't believe there would ever have been that growth in the number of top rate tax payers. In fact it just looks like a fabrication. And now we see its purpose.
So was the number inflated for this reason? It's possible. But if it was then the argument that there's been a disincentive is also wrong. There would have been none. The true figure raised would simply have been £5 billion or thereabouts with no real disincentive effect, and not the £6+ billion that the 2011/12 data implies.
To put it another way - we have to be prepared for a pack of lies over the next few days because that's what I'm expecting we'll get.
Thanks for reading this post.
You can share this post on social media of your choice by clicking these icons:
There are links to this blog's glossary in the above post that explain technical terms used in it. Follow them for more explanations.
You can subscribe to this blog's daily email here.
And if you would like to support this blog you can, here:

 Buy me a coffee!

As you have the stats, what percentage of total annual individual tax is contributed by those falling into the 50% marginal rate. I am led to believe that this group of taxpayer is responsible for almost 55% of the total tax revenue for individual taxpayers.
Then you’re just wrong then
The total is forecast to be £47 billion – a figure a lot, lot less than 55%
But that’s just typical of your evidence free prejudice
Well you didn’t totally refute that. After all we know as a fact that the top 1% of earners contribute almost 25% of the total tax revenue from individuals.
HMRC suggested last year that the top 10% of earners contributed over 54% of the tax take and last week a number of commentators suggested this figure may go as high as 60+%.
Why not appraise yourself of the facts?
I do
http://www.hmrc.gov.uk/stats/income_tax/table2-4.pdf
It;’s really not hard to be informed
But you guys don’t even try
So the top 1% of earners contribute 27% of the total tax revenue and the top 10% 57.6%
I am not far off am I.
Based on these figures you can maybe see why the high earners may feel a little hard done by in terms of their contribution
No, I wouldn’t
I just don’t understand you, Richard. A couple of weeks ago you were proudly using HMRC’s figures to justify the £6.7 billion.
Why is the sudden jump in people earning over £150,000 in 2011/12 an issue now? Didn’t you spot it a couple of weeks ago?
You have the air of a man who is about to be completely humiliated and now you’re parading absurd paranoia about the Treasury fraudulently manipulating the data.
As people told you a couple of weeks ago (which of course you ignored), justifying the 50% tax rate based on forecast figures was always going to be a nonsense. The only thing we can use is the actual data that come in.
Why HMRC might have been wrong and the silly conspiracy theories you attribute to it, is simply a sideshow. What matters is the actual data.
And there will be no actual data – it isn;t possible to process it in the time available
And there is no evidence of a disincentive effect inb the data
The reality is that the 50p tax rate will raise at least £5 billion. It is only an argument for disincentive that can counter that – and that requires and alternative to be considered – one that did not exist
So my analysis remains totally sound as does the explanation – a false set of data on the alternative may have been created – and if true, then that’s a fact
While I don’t always agree with Richard, his calculations on this appear to be correct given the data (whether that is correct is of course another question!). So I would love to see the workings that HMRC apply to whatever calculation they make.
“(whether that is correct is of course another question!). “..Precisely SF…
Richard has not demonstrated that it will raise £5bn.
Richard’s estimates were based on data provided by HMRC which he now appears to rubbish.
Richard, do you still stand by the £5bn estimate (in fact I think you actually said £6bn originally, “conservatively” rounded down from £6.8bn) given that it was based on data which you now accept is wrong?
As I say, all these predictions based on forecast data are nonsense. Let’s just wait.
Of course I stand by the estimates – they have to be right
Indeed – it’s impossible they’re not right since I simply said I had extrapolated them from HMRC data!
And even if the 2011/12 data is wrong it would only reduce the yield to between £5 and $£6 billion. You entirely miss my point if you think otherwise -= that point being that a false laffer hypothesis may have been built in
Hello Richard,
You say that there is no data available. What data is available? Just the projections?
I ask only because Ben Goldacre and James Ball were able to put together an breakdown of Putin’s election data using some simple forensic techniques within a couple of hours of it being available.
Worth considering maybe.
There is data – this is it
There is no data on what the economy would have been but for the 50p tax rate is what I said – there’s only guesswork
I still think a major rewriting of the tax laws is due as there are far too many loopholes.But i suspect that a tax cut for the wealthy will come about to encourage wealth creation a euphamism for the rich getting richer.[or am i being cynical]
Richard
The Guardian story mentions a study to be published next week. But in the meantime, we have HMRC’s table of illustrative changes, which gives numbers consistent with those mentioned in the Guardian story. It’s notable that the footnote attached to the “change additional rate by 1p” row says “excluding dividend income”. One possibility is that HMRC is estimating the effect of cutting the 50% rate without changing the top dividend tax rate. That would tend to lead company owners to switch their income from dividends to salary (certainly a cut from 50% to 40% would do that) which would ameliorate the effect on earned income tax collected.
I’ve posted analysis (including some critical commentary on your numbers) here.
It’s good that HMRC publishes these tables, but frustrating that they don’t give enough detail to allow us to work out what the numbers actually mean.
The one thing that the HMRC do not appear to be taking into account is the impact of the FSA Remuneration Code which was introduced in early 2011 – which requires (quite rightly) that a large element of bonuses, including those payable in cash, now be deferred into future years – given that bankers probably make up a significant portion of those earning over £150k, surely this would have the impact of pushing salaries into future years and hence the increase in those earning greater than £150k would not be as high would be otherwise affected. There would be some irony if the FSA Remuneration code which Cable pushed for and crowed about – would in effect become the mechanism used for the removal of the 50% rate – and if sucessful would in effect have been a very sucessful tax avoidance/planning mechanism for the bankers.
I would like to know how much account was taken of the impact of the FSA Renumeration Code by the HMRC when it prepared its estimates.
You’re right
And I have not mentioned it – but did think it
I suspect this is quite important
Banks already increased the proportion of deferred compensation in response to the Financial Crisis, typically starting from 2009. So the projected increase in people earning £150k+ may be because of the cumulative effect of deferred compensation: this year bankers are for the first time receiving substantial deferred compensation from each of the previous two or three years.
One might hope that the OBR would be able to exercise some degree of control over any manipulation given Chote’s previous IFS background – but I suspect that Osborne’s Treasury ideologues will have already covered that angle, especially given that he is the same building.
I wonder if there are any LibDems in government who still possess a backbone – or at least some memory of what they said to the electorate – who will do the decent thing and resign?
PaulB
I’ll think you will find that there were not a few banks that pushed bonuses from 2009/10 into 2010/11 so as to avoid the bank bonus tax and there are also a lot of banks which waited until the FSA Remuneration Scheme was agreed before starting the deferral arrangements. If you want to look at Barclays preliminary announcement re directors emoluments you will see quite clearly that the full impact of deferrals still has to work through.
Osborne made a comment at the last budget about it being the wise thing to wait until the impact of the 50% rate could be seen before deciding on its abolition – I think he is being political rather than wise.
I wonder how many are now trying to defer last years bonuses into the next tax year – the government now having tipped the wink. I don’t think that because the measure has been leaked to the Guardian that it reduces the stench one bit.
What a surprise.
Forgive the cynicism but I was expecting the report to come in low for no discernible reason.
I wonder whether HMRC with its large scale reductions in staffing levels is really capable of compiling meaningful data.
I hope ordinary people will realise at last that the Tories, if indeed they do make this tax reduction, have no intention of ensuring that ‘we are all in this together’. Why did anyone believe this in the first place, frankly anyone who did must be extremely politically naive.
Of course the Telegraph, like much of the right-wing press, chooses to dismiss the lack of real evidence about the harm supposedly done:-
“Despite mounting economic arguments against the 50p rate, some Conservatives feel that scrapping the rate at a time of rising unemployment and falling household incomes would be a political mistake….”
[…] Why the leak by Whitehall sources? Could the Treasury be falsifying the data on the 50p tax? HERE Will scrapping the 50p tax rate encourage the wealthy to raise wages, spend more, donate to […]
Richard, regardless of whether the figures have been ‘cooked’ in some way or another by HMRC, or whether the estimates you and others have come up with to prove/disprove the outcome of the 50pm tax rate are correct, from a policy making perspective one thing is absolutely clear. The less evidence there is of the impact of the rate (or indeed any policy) the easier it is to dump the policy. It follows therefore, that getting rid of a policy – in this case the 50p tax rate – sooner rather than later is an imperative, particularly where a government is ideologically opposed to said policy. This is a common and long established strategy of governments, particularly where they inherit policies that have not long been in operation from prior administrations. I have no doubt whatsoever that policy advisers and senior civil servants in the Treasury brought this to Osborne’s attention some while ago, if they didn’t they wouldn’t be doing their job very well.
Indeed
Ivan
But Osborne needs to be reminded of what he said at the last Budget about waiting for the evidence before making a decision. What I also find interesting is how he is not worried about the increasing numbers he is imposing a 73% marginal tax rate on because of the withdrawal of family tax credits, or even those on just over a £100k who face a 61.5% tax rate. For some reason Osborne believes that funds can only be found to encorage enterprise among those earning over £150k. The stark reality of this decision is that it based on tribal politics rather than being anything at all to do with economics. The more I look the more convinced I’m become.
I can’t disagree with your conclusion, stephen. Much as I hate to say it, as an academic who was a supporter of evidence-based policy making back in the mid 1990s, I have to admit that in most cases it’s now a term used by charlatans and liars – or if you like tribal politicians. You can chose which one (all) of those Osborne is.
Regretfully, I have to agree
I blame economists of a particular persuasion who decided that stats could show any answer so long as it was one that accorded with their prejudices
Those papers that do not accord with those prejudices simply do not get published, of course
By all reports the City wine bars were all doing pretty well last night – and it looks like George has found a way to make poorer regions pay for the tax he is failing to collect on the revellers http://www.bbc.co.uk/news/uk-17411117 – so much for one nation Conservatives, if such a thing ever existed.
I found a phrase on another blog which neatly encapsulates what you are describing: it is called
“decision based evidence making”
Richard, HMRC *can* only estimate figures for total income because taxpayers do not need to report total income to HMRC. Income from ISAs is exempt from reporting; realised capital gains from sale of principal private residence or below the threshold are exempt; unrealised capital gains are totally ignored; the value of employer’s contributions to pension schemes and the increase in value of personal pensions is exempt; income hidden away in Silveta and other personal service companies is excluded from personal tax returns; isn’t this one of your beefs?
But they do know taxable income
And this data refers to that
So stop making excuses
Ed Comment: Many comments from this commentator have been deleted in the last day. Trolling is no acceptable behaviour
Looking at the HMRC data, it doesn’t look that wrong – when you remember there is such a thing as inflation. This moves a certain number of basic rate taxpayers into higher rate and higher rate into additional rate, with the limit of pension contributions doing likewise – the amount of income of people earning over £50k who aren’t liable to higher rate tax is forecast to halve.
9.6% income increase in a year?
Pull the other one
It’s not a 9.6% income increase: it’s a 9.6% increase in the number of people with incomes over £150,000.
And that is utterly implausible, which is my point
9.6pc income increase isn’t that implausible. I am aware of plenty of individuals in my sector earning over 150k who have got annual increases more than double that amount. Plus you have the super rich who no doubt are earning more, plus the deferral effect of the bank remuneration code.
In that case the 50P tax is even more justified
Correction: a 9.1% increase in the number of people with incomes over £150,000. The increase in average earnings in that group is tiny.
[…] budget. I have already explained the substantial cost that will be suffered if we do so, and the statistics that may be manipulated if  the Tories decide to adopt this course of action. What is now clear though is that this issue […]
“Let me offer a cynical explanation that might do just that, and which would imply fraudulent manipulation of data by the Treasury.”
I am sorry, I don’t accept that our civil servants would ever do this.
I am sure they only ever act honestly, in good faith and doing their utmost in the best interests of the public they serve. Sure, there may be the odd rogue, but it is so insignificant that it would not affect an exercise such as this.
How sweet of you
But if true then expect them to say the figure raised is £6.7 billion
If not, someone’s been telling porkies somewhere
Run through the retired senior civil servants that now work in the private industry that they used to “meet” via their ex-work ?
Maybe a quicky look at ex-forces very-senior-now-retired ranks that now work for defense companies ?
And how many ex-employees of the B4 accountants now work for the EU, and other large “companies” like the UN ?
How many ex-police senior ranks now work for security companies ?
I do not recommend stirring this particular barrel of fish too long, the stench of corruption is overpowering.