I so agree with this:
Thanks for reading this post.
You can share this post on social media of your choice by clicking these icons:
There are links to this blog's glossary in the above post that explain technical terms used in it. Follow them for more explanations.
You can subscribe to this blog's daily email here.
And if you would like to support this blog you can, here:

 Buy me a coffee!

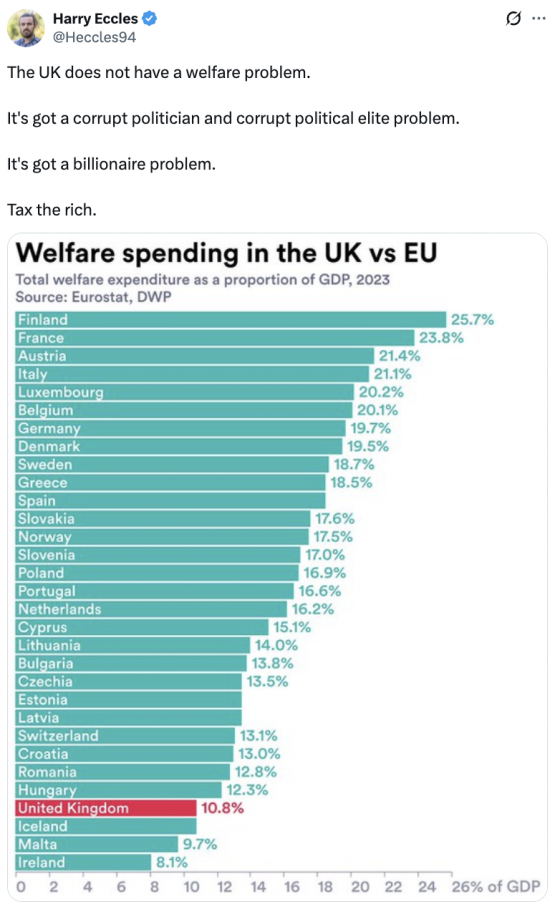
Many thanks for this excellent reminder. More proof as if any were needed, of just how deep is the economic morass we are wading through. I thought the UK figure was even lower (more like 7%) from official government statistics that I have seen. Nevertheless, what is absolutely clear is that we a not investing anywhere near the amount that we should be in welfare, and have not been doing so for 20 years or more. Which means that the relative gap between the UK and the EU is widening and accelerating.
I looked at a breakdown of Danish spending. They seem to do the politics of care.
Much better than we do. Free educti9n to PhD level as well.
Not only that, but isn’t there a surplus in the UK?
Sorry, but surplus of what? Certainly not in government finances.
Well you will have greater knowledge of this than me, but I had read that welfare is under claimed, in terms that the monies allocated by the government to welfare, whatever that figure is, is higher than what is actually claimed by recipients?
So, say 20 million is put aside for welfare in a calendar year, only 17 million is paid out in that year. So what do you call the 3 million not used?
Quite possibly I am understanding this completely wrong, which is fine as I will learn something with your response. 🙂
OK, that is correct, but I could not have gessed what you meant. Around £20 billion a year is unclaimed.
More informative is the “Purchasing power standard (PPS) per inhabitant” published by the EU. They included UK data to 2018. Showing that most northern European countries spent at least 50% more than the UK. The UK has never been a caring society.
Annual Purchasing power standard (PPS) per inhabitant:
2018 2023
Belgium 9.872,17 12.359,67
Denmark 11.651,88 12.769,85
Germany 11.367,32 13.900,49
Ireland 6.977,88 8.811,13
Spain 6.298,36 8.662,13
France 10.660,71 12.811,55
Italy 8.169,28 10.615,60
Luxembourg 14.968,98 18.396,24
Netherlands 10.878,61 13.381,40
Austria 10.806,44 13.577,03
Poland 4.578,08 7.060,93
Portugal 5.548,15 7.061,26
Finland 10.048,65 12.122,54
Sweden 9.810,38 11.578,24
Iceland 8.451,59 11.473,41
Norway 12.067,37 14.974,69
Switzerland 11.570,28 14.479,30
United Kingdom 7.656,02 :
Sorry, but tables do not reproduce here.
While I agree wholeheartedly that our social security spend is not a problem, please don’t call it welfare. That appalling US term is not what is offered in the UK. We offer social security.
I usually use that term.
I cannot believe where Ireland sits in all that above?
No wonder they were burning effigies of immigrants a while back and why my brother and I – who lives (and works!) over there – aren’t talking because of his attitudes. I’m nonplussed. A country that has suffered so much at the hands of England does not seem able or prepared to help its own, indeed mirrors the worst aspects of its colonial bully?
And where is the EU in all of this, who should at least be pursuing its peace project by snuffing out the discontent that breeds the far right? ‘Fucked up’ does even begin to explain this at all.
Talk about being exasperated!
Following on from the comment of Mr. Eccles, might the U. K. also have?
Political transparency/honesty problems
Main Stream Media objectivity/honesty problems
B. B. C. news and its derivatives ditto problems which result in a deficient public service performance
Interesting figures here on disability benefits
https://obr.uk/box/international-comparisons-of-health-related-welfare-spending-and-generosity/
Indeed
Coming 28th out of 31 countries is not an enviable position, especially when looking at some of the Eastern European countries above the UK.
We need to post this data in Calais.
Do the other countries have the same breakdown of welfare payments as Britain. For instance does their welfare include pensions?
These figures do not include pensions.
And we have social security. It was my mistake to say welfare.