The UK is a country of massive wealth inequality, with all the stress landing on those the wealthy think to be the undeserving poor, which is most of us.
This is the audio version:
This is the transcript:
We live in a country where most people live from payday to payday because there is gross income and wealth inequality.
We have a country that doesn't seem to care about that gross income and wealth inequality and the consequences that flow from it.
And my suggestion to you is a very simple one. We do need to care, because unless we do care about the nightmare of people living without the means to survive, literally from month to month, in many cases, we will end up with a country where extremism is bound to prosper.
The background to this is simple. Most people in the UK have low income and they do not have adequate savings. And so there's a series of questions to ask.
What are the consequences of that?
Why do we put up with it?
What can be done about it?
Is the problem of poverty and inequality always going to be with us, or are there better options?
And all that's what this video is about.
First, let's look at some facts. UK income distribution data is published by the government and by HM Revenue & Customs in the UK.
The information I'm now putting up on this chart comes from the government, but in practice, there are real problems with this data, as if they didn't want to tell us the truth, the whole truth, and nothing but the truth.
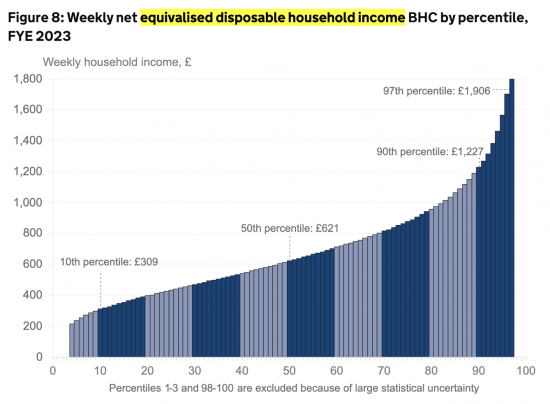
Those two problems are that, first of all, this information on income distribution is stated after tax, and most of us don't compare our after-tax incomes with each other. We compare our incomes before tax, and there's good reason for that. Tax bills vary for all sorts of reasons, and so this is misleading information.
And the second problem with the data on this slide is very straightforward. The top 3% of income earners are missing from the data, and that's because they earn too much. But that means that this representation of how income in the UK is shared is completely false. It makes it look as though things are more equal than they are. I don't believe the UK government should be doing something like that. This is something that I call an unknown known. They know the truth, and they're supplying you with information that is misleading as a consequence.
So, let's instead look at information which is available from HM Revenue & Customs. The data is unfortunately for the tax year 2022/23; that is the year ended on the 5 April 2023, and that is the most up-to-date that we've got with regard to declared incomes to HM Revenue & Customs, and the data looks at the distribution of income in the UK split between various percentile groups.
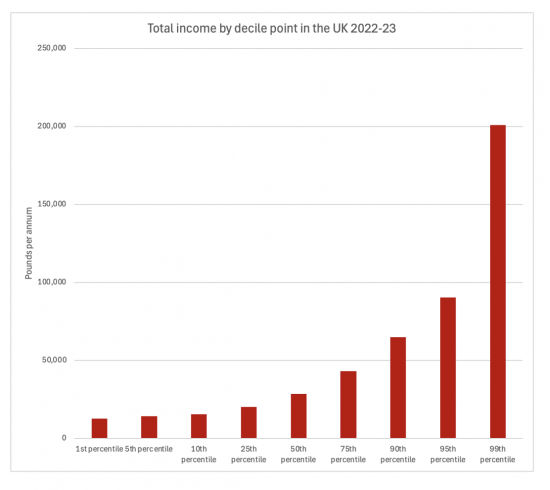
So, right on the left-hand side, the lowest of those red columns, we've got income for the bottom 1% of people who pay tax in the UK. And, I stress, this information is for people who pay tax, and I'll come back to that in a minute. And the people in that extreme group on the right are the people in the top 99th centile of income earners in the UK, a centile being 1% of the UK population who are in this top group.
And as you'll see, what is glaringly obvious is that the disparities between the incomes before tax of those in the bottom 1%, and the income of those in the top 1%, are dramatically different. And in between, we have a gradual profile of change.
What does it mean? It shows this. 50% of people in that tax year ended two years ago earned less than £28,400 a year. Now their household incomes might have been more, of course, because many households now have two income earners, but that's the income per person.
75% of all people earned less than £43,000 a year.
95% of people earned less than £90,500 a year, but some earned a great deal more.
In fact, in that top 1% of income earners, the average income was in excess of £200,000 a year.
So one group has the most enormous amount of income compared to almost everybody else.
Unsurprisingly, they pay more income tax than most people do.
You will have often have heard this claim that, oh, the top 1% paid 25% of all income tax in the UK. That's because they earn so much in comparison with everybody else. Don't think there's anything unfair about that. The unfairness is the fact that they've got so much income.
And importantly, this information only covers about 70% of adults in the UK. There are 17.8 million people in the UK who don't pay tax at all.
They will, for example, be old age pensioners who have no tax liability at all.
There will also be people on very low levels of benefits.
Those people skew the distribution even more strongly in favour of the left-hand side of the chart, the poverty end of the income spectrum.
So the vast majority of people in the UK are just getting by. But then we need to mix this fact with wealth data.
This chart shows wealth by groups in society, and the groups are basically split into 10. There are, in other words, 10% of the population ordered by wealth in each of the groups, except for the extreme right-hand category, which is for the top 1% alone.
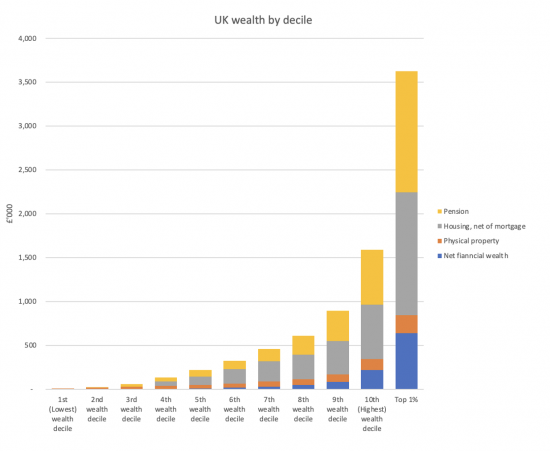
And what this chart shows is wealth split into four groups.
The yellow data is pensions.
The grey data is housing wealth net of mortgages.
The orange group is physical property, in other words, things like cars, your clothes and household bits and pieces.
And finally, in blue, there's other financial assets, savings, in other words.
And what have we got? A chart that is once again, heavily skewed so that the right-hand end of the scale, again, in this case, the top 1%, have got vastly more than anybody else.
And in fact, if we try to see where the bottom 10% are, they basically don't show up. The reality is that one-third of the population of the UK has less than £50,000 in wealth, and none of that is in property.
Half of the population has savings of less than £8,000, and one-third of the population has savings of less than £1,000, and the bottom 10% have none at all.
When I say that people survive from payday to payday, what I really mean is they have savings that are so small that if the next pay cheque doesn't turn up, there is no buffer available to cover any unforeseen eventuality that arrives in the meantime. At least a third of people in this country are living in that way: 📍 in absolutely precarious situations where anything going wrong can represent a financial disaster in a way that for the wealthy is totally unimaginable.
The wealthy do, in fact have on average, and this is the top 1%, wealth of £1.6 million each. And remember, that's not per household. That's per person. And they have therefore more per household than the bottom 70% of the population combined per household.
They have financial assets, that is savings, of more than £200,000 on average. There is no calamity that is going to hit them on such a scale that they're going to be in crisis as a consequence. This is what gross inequality looks like.
And this distribution is not just about these decile groups, the groups of 10%, into which I've categorised everybody there, using data from the Office for National Statistics. There's another problem with inequality. It is also seriously geographically uneven, as this map of the UK shows. People in the southeast of England have three times more wealth than people in the Northeast, Cumbria, Lancashire, and Northern Ireland.
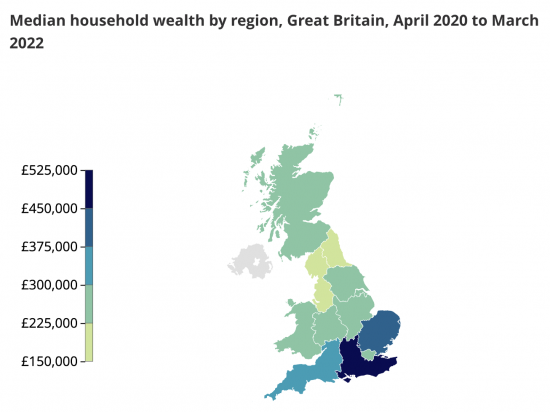
Scotland and Wales are poorer than any part of Southern England. There is, as a consequence, massive gross inequality within the UK.
And that's not the only thing that we've got a problem with. There's also inequality by age range. This also impacts people really heavily. Look at this chart, which provides this information, again, with data supplied by the UK government.
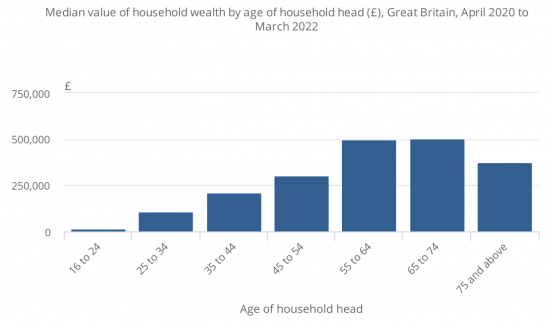
The young have virtually no wealth at all. Now, you could say that's unsurprising. They've never had a chance to earn anything, but that means that they have no margin for error as well. So some of the poorest people in the UK, the young, those who are more likely to make a mistake, have no margin for error to deal with it unless they have a parent who's willing to help them out, and not everybody is in that fortunate situation.
Then look at who dominates wealth by age. It is those from 55 to 75, but there's a perverseness in this. When you reach the age of 55, you've actually reached the point where you have relatively few responsibilities, in most cases. A lot of people have had their children and they've left home by then. So at the point where people have the greatest prosperity, admittedly before they retire, which is one reason why their savings are so high, because pensions do obviously dominate this scale, but even so, at that point where they have no responsibilities left, they have the greatest wealth.
And what that means is that actually we're also leaving young families, and you can see where they sit on this scale, well down the order, in a situation where they, too, are short of the wealth they need to deal with anything that comes up that might affect the wellbeing of their children.
We've got a situation where we have this gross inequality, and so what is the government going to do about it?
This is a headline from the Guardian newspaper made this month, May, 2025, where Liz Kendall, the government's work and pensions minister, is celebrating the fact that the £5 billion of disability benefit cuts that the government is going to put into place will supposedly stop the welfare state from collapsing in the UK.
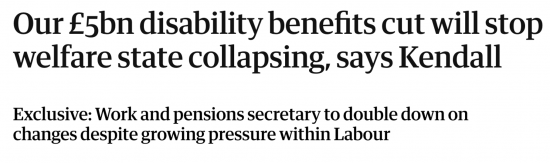
First of all, that's not true. The UK's welfare system will not collapse for the sake of £5 billion because the government could find £5 billion very easily in a total annual expenditure budget of well over £1 trillion, or in other words, more than £1,000 billion. £5 billion is neither here nor there.
But what Liz Kendall is choosing to do is penalise those who don't even get onto that income distribution chart that I showed, because the vast majority of people with disabilities don't have any taxable income at all. She is hitting the poorest the hardest.
And that's what's happening, and the government is choosing to exacerbate this.
It has chosen to put no new taxes on wealth into place since it came into office.
It is not attempting to collect taxes, more taxes, from those on high incomes or wealth.
It is, as a consequence, being grossly unfair with regard to those who it is choosing to penalise because, it claims, we have a financial problem in the UK. It will charge the poor. It will not charge the wealthy. Inequality is set to grow as a consequence.
We live in a country where, as I have said, people are living from payday to payday without the means to manage any of the insecurities that might arise in their lives.
That is the consequence of gross inequality and that gross inequality is getting worse, even if the official statistics that the government puts out don't show it because of the uncertainty about just how wealthy are the wealthiest, and just how high the incomes of the highest earners might be, which the government admits in its own data.
And the outcome of all of this is obvious.
31% of children in the UK live in poverty.
We have growing ill health, and there is a direct correlation between ill health and poverty. We know that.
There is rising mental ill health, and that's unsurprising when you force people to live in precarious situations where they have no resilience. Of course, they are going to be very stressed.
We have growing educational divides, because not only are those divides in regional wealth real in themselves, they are also reflected in the resources that the government is willing to supply to educational authorities around the country and the councils that fund them, because they are underfunded in the places where need is greatest.
It is as if the government doesn't care.
And the consequence, of course, and perhaps the one that worries me most of all, there are young people with no hope.
The government says that it's worried about the fact that almost 10% of young people have never worked and might not work because of their ill health and other causes. And yet they're doing nothing to address the problem by providing these young people with the chance and the hope that they might one day improve their situation as a consequence of working, when it's very clear from this data that working will actually solve nothing for them. And all of this is coming from a supposed Labour government: a government that I call Labour In Name Only, or LINO for short.
No wonder that the Reform Party is popular.
No wonder that they are winning votes.
We've built a country without resilience.
The far right is exploiting that.
So what do we do?
Well, we have to build a country that cares.
We have to redistribute income and wealth. It's as simple and straightforward as that.
We cannot live as we are. People cannot live in the circumstances that we are forcing them into.
We are rich enough to be able to ensure that everyone in the UK could live at least adequately and without fear, but we aren't.
We are not delivering that most basic of things that any government should do, which is to supply freedom from fear.
So why don't we do that? It's because the wealthy have been told they're worth it.
They've been told they've earned their success and that it's theirs to enjoy.
They're worthy, the deserving, the righteous ones, in other words.
But the corollary is that there is now a revived concept of the undeserving poor in the UK. You can see it in everything that Liz Kendall, our Minister for Work and Pensions says. She obviously believes that, because that's why she's punishing disabled people.
That concept, that belief that there are people who simply don't deserve our support, is destroying equality in the UK.
It's encouraging fascism.
It's denying families and their children hope, and it's destroying their futures.
We could have a land of hope, but only if we redistribute income and wealth.
What would you do?
Thanks for reading this post.
You can share this post on social media of your choice by clicking these icons:
There are links to this blog's glossary in the above post that explain technical terms used in it. Follow them for more explanations.
You can subscribe to this blog's daily email here.
And if you would like to support this blog you can, here:

 Buy me a coffee!

It has been suggested that an annual property tax of 0.5% of the value of domestic property would raise as much as Council Tax does now.
Its basically the Northern Irish domestic rates system.
If you look at house prices in amongst other places Cumnock, Ardrossan, Goole, Barrow in Furness and Scunthorpe you can see that many people there would be paying less that £500pa compared with what the owner of a house in Central London might be expected to pay.
Yes, its not as simple as all that, especially in London but it seems to me that it offers not a solution but a potential tool to tackle inequality and inflated property prices
If a tax looks to be simple to be true, it probably is
The first challenge would be estimating property value. The second would be that it would penalise making improvements to housing stock.
A 0.5% tax would likely get about the same – from a quick estimate of properties I know the values of council tax of, it would charge somewhat more to a lot more in London but significantly less somewhere like Torquay compared to Council Tax. Unless those revenues were then shared around the country, non-city councils would be bankrupted by such a switch.
Agreed
Might it be valid to (also) label income as a form of money extraction from the economy?
Might it be valid to think that we have a clearer idea of the money etc. that people get from society than what they put into it?
Might taxation also reflect the productive, maintenance and improvement to society of the money gaining activity of the group and/or individual?
What might be an indicative score out of 10 for this government’s effectiveness in creating and maintaining an equitable, coherent sustainable society?
1, if we do not allow 0
Income as a form of money extraction from the economy?
Surely, “it all depends”. I suggest more refinement to your labelling?
Income that is spent **is** the economy, whether Tesco’s income or the council worker’s when they mow the public parks. It’s what is done with the income that affects the economy.
Jill riding on her tractor-mower will spend (almost) all her income in the next month, that is not a “extraction”. Tesco pays its suppliers – that is not an “extraction” either.
Tesco also pays dividends to its shareholders. If the shareholder puts those dividends into a pension fund for their old age, the income has been morphed into **delayed income**; unavailable for spending now, but inevitably to be spent in the future.
Money spent into the economy is (mostly, if we discount foreign holidays) not extracted from the economy if you take a long-term view.
All as I understand MMT, of course.
And, our society assumes car ownership or access to a car.
Hospitals are sparce in Dorset. Many areas are not even well served by supermarkets … and local shops have been driven out of business.
As my reflexes have slowed, I have sold my car but bus services are infrequent.
If the nation gets serious about climate change – and fears of floods, droughts and fires, – more people will become aware of car dependence.
In (say) 1935, almost everyone lived in the locality in which they worked. Family members mostly live a walk away from one another – and there were youth clubs (mostly now closed).
Thanks
Richard, you make an excellent irrefutable statistical and moral case on the rapidly increasing gross inequality that is, by design, a feature of our economy.
The media obscure the statistics, Dan Niedle says you don’t understand the numbers, but the hardest argument to win (with the politicians and media) seems to me to be the moral one.
No matter how well argued the case, no matter how many figures are quoted, the Liz Kendall’s, the Rachel Reeves’s, the Dan Neidle’s of this world appear to believe, and certainly, they PREACH, that there is moral hazard in taxing the wealthy, and moral virtue in punishing the poor, the disabled, the sick and the elderly at the lowest end of the wealth and income spectrum and that there is no problem, either practically or morally, in rapidly increasing gross inequality and all the economic chaos that goes with it.
So they feed us hollow arguments about the value the wealthy bring to our society, and the risks imposed by the poor on a welfare system in danger of collapsing. They preach a horribly perverted morality to make up for all the damning facts they can’t deny. But it is effective.
They are completely unable to argue their case, they always lose, in a fair fight – but the fight, of course, is never fair. But they get the air time, and the MSM, the social media algorithms favour them relentlessly, and suppress their opponents.
Morality interests me, I’m a “god-botherer” after all, and that’s what profoundly distresses me when Liz Kendall gets away with telling us she daren’t restore the WFP or abolish the 2 child benefit cap, in case the welfare system “collapses”. And whoever is interviewing her doesn’t fall on the floor having a fit of hysterical giggles at her ridiculous stupidity, but lets her get away with it.
I’m not one for despair, perversely, as a god-botherer I believe the good people win in the end, and that gross evil is self-destructive (although we should do all we can, each with our own gifts) to speed up that process, but right now, I’m depressed and angry along with so many others here.
But this is a lantern in the darkness, so KUTGW!
It is good to see those graphs, so many commentators on social media never really define what they mean by “the wealthy”. Despite wanting to tax those wealthy people, there’s never any calculation of how much they expect to raise – and that’s before there’s any acknowledgement of the MMT lens that shows how government funds the economy.
Dan Ariely did a TEDTalk 10 years ago on inequality, and brought Rawl’s Veil of Ignorance to the table too. We “mere oiks* just cannot comprehend the vastness of the gulf between the bottom 5 deciles and the top 1 decile.
https://youtu.be/2tCcoSRZqVY?si=thp9CxwrTW0eBWx9
(I know Ariely has a mixed reputation, but I still recommend this particular Talk for its verifiable – albeit old – data and the visualisation thereof.)
About 15 years ago two social scientists published a book “The spirit level” which showed that inequality is a major cause of crime.
Has anybody noticed? Of course not.
I know them both
Great book! I remember gobbling down their stuff in my foodbank managing days. My then MP, Tory Michael Tomlinson, wasn’t convinced, he kept telling us the neoliberal mantra, “work was the best route out of poverty”.
But he lost his seat in 2024.
This is their site…
https://wilkinsonpickett.com/the-spirit-level/
2018 sequel “The Inner Level” which I haven’t read yet.
I think the level of precariousness is perhaps greater than outlined. Property and physical wealth increase earlier than financial wealth.
To some extent this represents people getting a house and/or a car, quite possibly on finance. This means that while they are accumulating assets while this is paid off, they have significant financial commitments while their financial assets remain modest.
I know various people with top 10% income in the upper half on wealth who would struggle massively if their employer went bust or they otherwise had a loss of income for even a couple of months, because the financial portion of their wealth is very limited relative to their outgoings.
I’d therefore suggest that we should place that bit more focus on the financial part of wealth, and how that only overtakes physical wealth at the 9th decile of wealth, and that, perhaps, marks a point where lending is rather less required for non-property assets, and really demonstrates where wealth is becoming more secure.
Something like 30% might struggle if losing income for a month. 50% might struggle if losing income for 2 months. Maybe 2/3 would struggle if losing income for 3 months. If your employer goes bust, you might lose a month’s pay and then take a couple of months to find new work, so that’s a very high proportion of people with insufficient financial wealth to cover that.
But if you have wealth in property you have something to realise if your income drops. The wealthy only don’t have enough money to live on if they continue their living standards. Drop those a little and there is no probem. Sell the house and get a smaller one. Sell the house and rent. You still have options that those further down just do not have: no house to sell and if they can’t pay the rent, then they have no home, fairly quickly.
Correct.
But never understood by thsoe who have wealth.
Cyndy, I think you have hit on a sorely underdiscussed issue here: how to lower your living standards.
The vast majority of those who perceive themselves as ‘not poor’ are absolutely petrified of lowering their living standards – it is literally unthinkable to them. Why? One, zero imagination – other than drastic measures such as selling the house, they have been materially de-skilled and simply don’t know how; and two, mortal terror of being turned upon or excluded by their social circle.
I could write volumes about each of the above, but I do think that politicians of the left should think about this a bit more. Demonisation of the poor doesn’t affect only the poor, it keeps the wealthy frightened too: part of the pump that keeps the money moving upward.
Much to agree with
Only to some extent, chiefly because illiquid assets incur very significant transaction costs if you need liquidity. If you have to urgently down-size because of something like a loss of income, then quick-sale companies will offer you around 85% of market value.
For immediate need down-sizing, lose £60k+ of property value and the 4th decile is wiped out still. The 5th decile might keep enough to cover their short-term finances but any further shocks and they could be wiped out, too.
Where they may have more means to avoid this is instead more borrowing. This is clearly preferable to bankruptcy. However, those extra outgoings may mean years spent getting finances back under control.
This is potentially where some of the hostility to supporting those on lower incomes can arise, too. Policies that might bring down house prices significantly might moderately affect those owning property outright, but it could wipe out the wealth of middle deciles who only recently managed to buy.
It’s all very well suggesting someone could downsize, but aside from the cost of moving, that £95k of property wealth may be a modest share of a flat in London. Then it’s not downsizing, it’s relocating, likely away from the jobs that are still needed or support from family members. Or they now have family and a 1 bedroom flat is not suitable and would leave them potentially worse off than someone in a lower wealth bracket with access to social housing.
Here the benefits system doesn’t help. If you rent and lose income then housing benefit may cover your rent (depending on your property), but a mortgage-holder will get the interest covered and have a shortfall for the rest. It’s reasonable that benefits don’t repay someone’s mortgage, perhaps, but instead the government should perhaps look at introducing rules so that someone can extend the duration of their mortgage by however many months, switching to an interest-only period, allowing the government support to be right-sized without leaving the claimant in arrears. That costs the public purse no more than now, but helps those middle deciles be in a less precarious position.
I don;t think Cyndy was talking avbout fire-sales
I think she was talking about planned reductions in consumption
To respond to Richards suggestion, if you were talking about a planned reduction in income, then I wasn’t, because the topic was about being one payday from disaster – primarily UNPLANNED reductions in income.
My last employer (Builder.AI) was a billion dollar company that just entered liquidation. Some planned to leave and got a nice voluntary redundancy package. Some didn’t plan to leave and are now facing a massive hole in their finances. I have dozens of former colleagues who would be in the middle deciles who are right now facing exactly that kind of income gap that I outlined, and who are very much worried about not just losing a little but everything they’ve worked to accumulate over the last 10 years or so.
Where in the middle deciles?
It sounds like this was not a low pay employer.
Cyndy suggested care in spending in good times.
Why not address that?
It’s potentially helpful to look at demographics and where people sit. Peak income is later in careers, and wealth peaks even later.
Young-ish professionals (e.g. those in their 30’s to early 40’s) are amongst those that are represented in the middle wealth deciles. They are likely to have stretched to buy a property, have high levels of debt, etc, and may well have a child or children.
These ARE the savers that put money aside in good times, they’ve just had to make those savings illiquid in order to buy at all. They have care in spending in good times.
The point is that the stats reproduced here show an employer insolvency could create a liquidity crisis for a majority of people. Those above 55 in the middle deciles may be able to take a pension lump sum and on average have more wealth anyway, but you could estimate amongst under-55s a majority would struggle to deal with a 2-3 month loss of income. The point is that financial insecurity is unfortunately the norm for most adults that aren’t approaching retirement age, and that we could and should do better.
David
Please read the title of this thread. One payday away from disaster.
DISASTER is not being unable to maintain an opulent standard of living. Disaster is not having to put the children into state schools. Or having to survive on less. Or not being able to return to the previous luxurious standard of living for a few years. Or not being able to go on holiday.
Disaster is being homeless, being unable to feed the children, having nowhere to take a shower. Please try to understand.
Powerful and well-written.
I heard a very clever phrase recently, which highlights for me how real this problem is for so many of us – “Too much month left at the end of my money”.
would do this, RM’s clarity of purpose: ‘build a country that cares’ and work with the best evidence-base to create Thriving.
We live in a country where the established political and media don’t care, and the consequence is people without hope turn to fascists.
Thank you, Richard.
There are similar numbers in the US.
Both countries have in common elites that want / need people to live in debt and fear and worry daily about survival, not challenge neo-liberal hegemony. I met Cameron and Osborne a bit before the 2010 election and got that impression.
Richard and readers should watch footage of Kendall at the dispatch box with the sound down / muted. Her partner is a financier. The pair live in a part of London where houses are often sold for millions. Kendall is a sadist and thinks that she has to act like that because people in finance are like that. That would be news to the likes of Clive Parry, Robin Stafford, John S Warren and me.
Reeves’ parents, both teachers, split when she was young. It has been suggested that she carries the scars from that and seeks to take what she suffered on others. Like Kendall, she thinks she has to act tough to impress a City where her career did not take off. It was the same with May, according to former colleagues of hers. Cameron and Osborne did not work in the City, but felt the same.
“We are rich enough to be able to ensure that everyone in the UK could live at least adequately and without fear, but we aren’t.”
And that is why we need a universal basic income.
Some people will say we can’t afford it. That’s b*llsh*t as your data shows.
Some people say it’s a moral hazard, that people should take responsibility for themselves and not depend on the state. But there is no way to separate the “deserving” and the “undeserving” poor (any more than we can distinguish between the “deserving” and the “undeserving” rich – though most rich people seem to think they are “deserving”). So we have to have a universal benefit. The moral wrong is to leave people in precarious poverty.
We already provide a universal benefit, of sorts, but it’s highly regressive. Most people get a tax allowance of £12,570, worth £2,514 at 20% tax rate. But if you are lucky enough to earn above about £56,000, where the tax rate is 40%, you get a benefit of £5080. And that’s not including the benefit from pension tax relief which overwhelmingly favours the wealthy. Meanwhile the poorest in our society, who don’t pay tax, get nothing. The fair solution is to abolish the tax allowance and pay everyone a £5000 basic income. That would make a huge difference and, obviously, we could afford it.
You are ignoring many of the problems
Not so much ignoring – just wanting to comment rather than write an essay.
There are, doubtless, practical difficulties. All changes are difficult in some ways. I would very much like to hear what you think the difficulties, or disadvantages, are (sometime) and, perhaps, your preferred alternative. 🙂
Richard could you talk more about the constant menace (which in my view is false) that wealthy people if taxed too heavily will disappear for Dubai or Saudi Arabia or Monaco or other areas they will not be subjected to wealth taxes?
This is in my plans
Meanwhile, Tackler, you might have a look at Gary Stevenson’s little youtube video, which goes some way to explaining why the asset-rich leaving the country need not be the problem it is made out to be.
Whilst I agree with Tim Kent to an extent that some form of UBI could be found in the future I think what would be easier and help most people especially the poorest would be universal basic services.
All child care
All Local Travel via Rail and bus network
All utilities including internet
Paying for these nessecities of life takes a far larger ammount from the poorest and low paid than the wealthy in our society.
What’s your opinion on this please Richard
Perhaps a future video on the pros and cons??
Whilst I have sympathy for this perspective, I’m not sure I agree. However the two approaches are not necessarily mutually exclusive.
In general I’d rather people had the financial means to support themselves, and make their own choices, rather than being gifted what someone else thinks they need. For example I would like to see the winter fuel allowance consolidated with the state pension (and also the state pension increased to nearer the European average). A plethora of hypothecated benefits leads to complications (especially if they are means tested).
The money could and should be recouped from the wealthy, who don’t need it, via the tax system
I don’t think the £5k universal basic income is sufficient. I just gave it as an example of a benefit that is already being given to higher earners. And, yes, I can see complications, as Richard commented. For example what about children? But I don’t want the perfect to be the enemy of the good. I’d love to hear Richard’s thoughts on a UBI.
🙂
@Tim Kent
Go to your favourite search engine and enter this search string:
I’m not saying that Mitchell is right. What I am suggesting is that using the search results will give you plenty of arguments about the two systems of helping people to thrive.
Before you begin, I would recommend that you drop notions of what “work” means: it does not have to be 8 hrs / 5 days / 50 weeks.
@Tim Kent
Wrong punctuation for the search string did not transfer to post-moderation.
Bill Mitchell UBI v JG
Lots of results.
I saw the first graphic and switched to video so I could look at them while your words came in my ears. An excellent video. Thank you, I imagine it will get seen by many. I managed to get a letter into the paper yesterday, pointing out that during the postwar consensus, high top marginal tax rates were used by governments both right and left. I was responding to an article where the term ‘soaking the rich’ was used, in connection with LINO seeking to dissociate itself from this ‘far left’ idea of high taxes on wealth. I think my MP needs to hear from me again, now my jaw is back in place after reading that the pound will collapse if we don’t cut benefits. Arghh. If I just read the papers, I might despair, I need output like your blog for my sanity. Dystopia is at the gate.
Thanks
Keep going….
We are living in a country where people aren’t just running out of money – they’re running out of time, choices, energy, and hope. There’s too much month left at the end of the money, and that, my friends, is not just a budgeting issue. It’s policy by cruelty.
So, what would I do?
First, I’d stop pretending the UK is broke.
We’re not broke. We’re just broken on purpose. Modern Monetary Theory makes this crystal clear: a government like the UK, which issues its own currency, doesn’t have to “raise money” before it spends. It’s not a household. It doesn’t check down the back of the sofa before funding the NHS or paying for school dinners. It creates money by keystroke. The real constraint is inflation, not some mythical budget deficit monster hiding in George Osborne’s wardrobe.
Then, I’d tax wealth – not because we need the money, but because we need to un-rig the system.
Let’s be honest: a primary school teacher doesn’t have a secret ISA in the Cayman Islands. But the ultra-rich? They’ve got accountants with airmiles. As John Boxall pointed out, even a simple annual property tax – like Northern Ireland already uses – could flatten out some of the madness. In Scunthorpe, it might mean less than £500 a year. In Mayfair? A fair chunk more. We don’t have to burn the mansion down, but it’s time the butler chipped in.
I’d implement a Job Guarantee, and maybe a Universal Basic Income too.
Why not both? Tim Kent made a sharp point: the real “universal benefit” we already have is the £12,570 tax-free allowance – and it’s regressive. Rich people benefit more. Flip that. Scrap the allowance, give everyone £5,000. Yes, everyone. Because the whole “deserving” vs. “undeserving” poor thing? It’s a Victorian hangover that should’ve been buried with workhouses.
Or, as pat the publican suggested, maybe we focus on universal basic services: free transport, childcare, internet. Imagine a world where a young mum doesn’t have to choose between nappies and broadband. Now imagine a government that wants that world.
And I’d fight the myth that the rich will flee if taxed.
Look, if a billionaire really wants to swap Dorset for Dubai to avoid paying a wealth tax, I say: bon voyage. They’re not exactly the types who host the local street party anyway. The idea that they’re holding the economy together with their cufflinks is laughable. We’d survive. Probably even thrive.
Lastly, I’d rebuild hope.
Robert J’s comment hit hard: this isn’t just economic injustice – it’s a moral crisis. We’ve built a system where the poor are punished and the rich are canonised. Our politicians preach “fiscal responsibility” while cutting disability support and letting crumbling schools fester. It’s perverse.
And when young people have no reason to believe their hard work will ever give them security, they don’t just check out – they lash out. That’s how fascism creeps in. Not in jackboots and armbands, but in viral soundbites and dogwhistles.
So yes – we must build a country that cares. That funds what matters. That stops judging people by their bank balance and starts valuing them for simply being human.
MMT doesn’t give us utopia. But it gives us permission to stop pretending austerity is inevitable and start asking: what kind of society do we want to build?
Because right now, we’re not out of money.
We’re just out of excuses.
I fully understand the concept of one pay day from disaster, there is also, as someone has suggested the ‘too much month at the end of the salary’ issue.
To my mind part of the problem is payment, for many people, of the same amount of income on the last day of the calendar month. The problem is that the same amount of money has to last for a different number of days. The money people got on 31 January has to last them for 28 days to 28 February. This year, in November payment is made on 28 November and has to last 33 days to 31 December. For those who struggle with their income, making the same amount of money stretch for an additional 5 days is a huge hurdle.
Universal Credit is also paid on a monthly basis (IDS idea, based on his experience that everyone gets paid monthly). Everything else in the social security system is based on weeks. A week is a constant, a month is not. But if you work for an employer who pays you every 28 days or every 14 or 7 days (more constants) UC cannot cope because they think your income has doubled on the 13th payday in the year, so UC gets stopped.
Anyone want to join my one woman campaign that equal monthly salary payments are inappropriate for the low paid?
That would make company payroll management incredibly complex. But it could be done.
Richard, my little business includes running payroll for SME’s. Equal monthly payments for those close to NMW is a complete nightmare. Not to mention the fact that there are about 10 different ways to calculate an hour’s or a day’s salary, when people are off sick and only entitled to SSP. An hourly rate of pay and 4 weekly payroll is the simplest possible method. Monthly equal salary always results in people getting less than their contractual entitlement.
But it does not interact well with HMRC, or benefits, does it? Isn’t that a big issue?
It’s definitely not a problem with HMRC.
It is a benefits problem because UC has been designed on the basis of monthly income, while all other benefits are based on weekly income. UC is the outlier and should be re-designed. Or done away with and replaced with something that works.
My pension is piss all since after 4 years working after returning to work after having 2 kids I became ill and after 2 years got sacked. And I didn’t have much payments to pension before that. Over half my personal income is my PIP payments (currently top rate for both Living and Mobility. All of the Mobility component goes for my car (which I can’t even drive myself, but it makes husband’s life easier and is a Godsend when it comes to going way on holiday). I don’t know if I will continue to get the same PIP with the new cuts this LINO gov hopes to make. And I do have to mention here that actually getting PIP is a bloody nightmare even before these cuts coming in.
The only reason I can afford to buy clothes for myself (OK, I don’t buy the cheapest – sorry!) is that my parents left me some cash. I dunno how much hubby gets from his pension, but prob not a lot more than my current total income. And he worked for most of his life after Uni, with a couple of years off when he was made redundant. Thank goodness we were able to buy our current home outright and get it done up and extended using cash from my parents.
Sorry to moan – I know I’m well off compared to the poorest in this country. I can’t believe that LINO is being so awful over helping out parents to be able to feed their kids – the 2 kids cut off for help is just disgusting. I despair. And spend a lot of time praying – what else can I do?
I think for me, once again the link between party funding and pro-rich policies that helps us to become an elective oligarchy as Michael Hudson has pointed out, raises its head again.
Economic inequality can only be addressed if the democratic inequality is dealt with.
We should ALL be able to expect something that benefits us from our politics. Politics has become very one-sided, all they seem to have been doing since Thatcher is take things away.
Democracy is surely about delivering the greatest amount of social welfare to the greatest amount of people – its positive breadth of impact – when in fact it is far too narrow in practice. I would base policy on that definition.
We need to start from at the beginning don’t we?
Kids still going to school are still educated to think of a long term career, your going to be a fireman, teacher, bricklayer, nurse etc. This reality, I don’t think exists anymore.
They are never taught the vagaries of life, never taught the confidence to manage themselves and their expectations if things don’t work out.
And yet – there is an underlying concept that those on UC are expected to be able to turn their hand at anything and be a success. Oh and if you don’t work, what are you? And I don’t mean the obvious answer there – which are vile press would quickly a scream out.
People confuse who they are with what they do. When you lose everything, how do you maintain a healthy, positive view of yourself and your values in the world? Where is the system of support to keep you motivated and persevere as well as maintaining values and a solid sense of identity no matter what your life circumstances are???
We need a big re-think.
There is some more evidence on this coming tomorrow.
Thank you Richard.
I think it goes further and it reflects the deliberate political choices made…in the interests of the so-called elites.
A very summarised version is taken from Simon Reeves’ current programme on Scandinavia. He makes 2 fundamental points:
1. There is – generally speaking – a trust in government, in communities and in the general population. I would suggest – which he doesn’t expound on greatly – that this fundamental trust in government to act in the overall interests of all in society doesn’t exist in the UK government; and,
2. That trust extends to government being expected to act to benefit the whole of society (not just the elites). Further, he uses the example of the Norwegian sovereign wealth fund which was designed to benefit all in society and not just the corporations, investors, the elites.
He goes on to make the point that taxation is high but ALL benefit via the welfare, education, etc., system and people recognise that these higher taxes are necessary to provide this support / welfare system…and, despite these high taxes, they generally enjoy a high quality of life.
Sadly, our system achieves the opposite and is designed to maximise the benefits to those who are most likely to be asset-owning wealth extractors, rather than working (in some capacity) as wealth creators.