Rachel Reeves' Spring Statement either doesn't add up, or it reveals a deeply dangerous economic policy, and it may do both.
This is a long post and video - but stick with it. This one might be really important.
This is the audio version:
This is the transcript:
Rachel Reeves isn't telling us the truth, the whole truth, and nothing but the truth about her Spring Statement and the forecasts that have been made by the Office for Budget Responsibility in particular, I've been preparing accounts for nearly 50 years and financial forecast for over 40 years and have the hair to show for it. And as a consequence, when I read a forecast, I have an innate feeling of whether the figures really add up. And the more I looked at yesterday's Office for Budget Responsibility report, the more I felt that there is something horribly wrong in this forecast, and it all comes down to what they're saying about interest rates.
So I want to run you through the data, meaning that this video is going to be a bit more techie than average, but bear with me because this is worth noticing because the consequences of what I think is going on are really significant for the way in which the UK economy is going to be managed over the next four or five years.
Let's start with the first chart that is important here, which is the Office for Budget Responsibility's forecast of where the Bank of England's base rate is going over the next four to five years, and this is it straight out of their report, published yesterday.
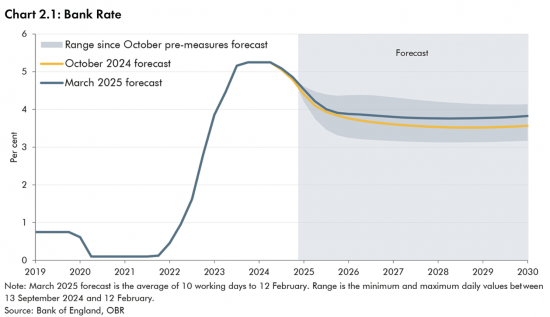
As you'll see, they are forecasting that the Bank of England's base rate is basically going to fall to 4% sometime later this year, and then flat line from then on until 2030. There will be no further cuts, therefore. That is the figure that they're forecasting that the Bank of England suggests is the appropriate rate for the cost of base borrowing inside the UK economy.
But we then move straight on to this second chart, and that shows the Office for Budget Responsibility's forecast for the cost of government borrowing over this same period.
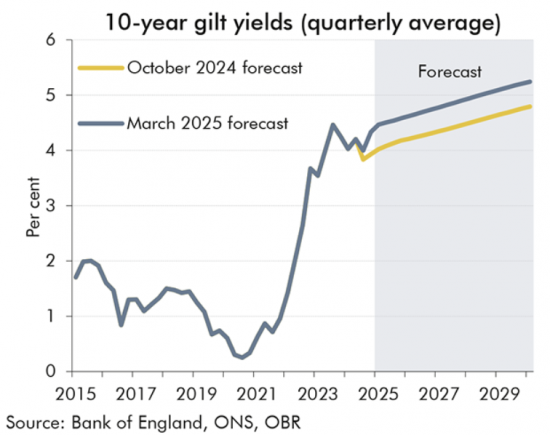
And the grey bit that is highlighted is the forecast zone, and the white bit is what has already happened, and as you will see over this period, they have forecast that the cost of government borrowing is going to rise significantly. In fact, right now it is, near enough, 4% on average over all forms of government borrowing, but they're suggesting that the figure might rise to well over 5% over this period, so above the base rate.
The cost of government borrowing is going to rise. And this is quite contrary to the usual pattern of correlation between the base rate, particularly when it's at this sort of level that we've got at the moment, and the cost of government borrowing. They should be broadly equal, but they're not. The base rate is flatlining. The cost of government borrowing is going to increase significantly.
So, I then went and thought, well, what other borrowing cost is most significant in the economy? And the next chart is all about mortgage rates, because obviously that is how most of the interest cost within UK society is transmitted to the people who are going to pay it - that is those people who actually are borrowing to buy their homes, and this is the forecast that the Office for Budget Responsibility have for mortgage interest rates.
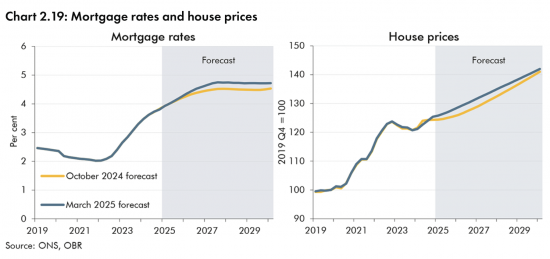
Again, this is the left-hand of the two charts here. The right hand one is interesting, and I'll get to it in a moment, but the left hand one is the mortgage interest rate cost, and you will see that just as is the case with government borrowing costs, they are forecasting that mortgage interest rates are going to rise over the next five years or so from an average rate of just under 4% at present, they are forecasting that mortgage interest rates will rise to just under 5% by 2030. In other words, another increase of around 1%, and yet the bank base rate is going to fall to 4% and stay there.
So, once more, we have this dichotomy. The Bank of England is going to set a base rate, and yet mortgage interest rates are, according to the Office for Budget Responsibility, going to rise.
And now let's just flip to the right hand of those two charts because it is interesting in this context, and that shows house prices and what the Office for Budget Responsibility is suggesting is that even though the cost of borrowing is going to increase significantly over this period - after all, an increase from 4% to 5% is actually a 25% price rise in real terms and therefore that cost is going to go up much faster than almost anything else in the economy over the next five years - there is going to be a dramatic increase in house prices.
They are using an index here, which starts with 2019 prices, which they have given the value of 100. They're now suggesting that house prices are at an average of about 125 i.e. they've gone up by about 25% since 2019, and they're suggesting that they're going to go up by well over 15 further percent over the next five years despite this increase in borrowing cost.
Just imagine what that message is going to be like to a young person who is now trying to buy their house. The price is going go up and the price of borrowing to buy the inflated purchase priced house that they're looking to acquire is also going to go up at the same time.
Let's look at this next chart because this is the inflation forecast.
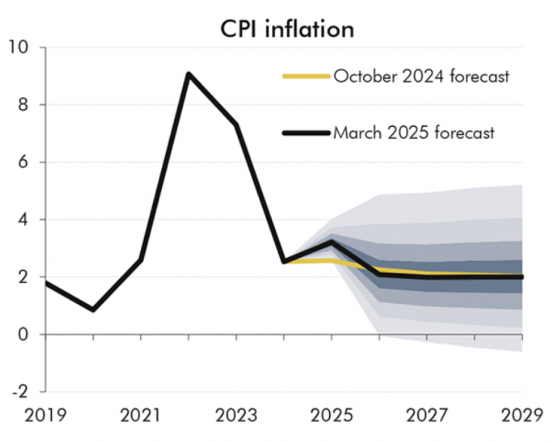
Now the critical line here is the yellow one, and it's a little hard to pick out in the middle of the range of grayness that the Office for Budget Responsibility is offering. But, basically what they are saying is that from now until 2029, the inflation rate is going to fall overall from around nearly 3% now, which is actually 2.8% in reality at this moment, to, near enough, 2% from 2026 to 2029 when nothing is going to change again.
Let me draw some comparisons. This means that the Bank of England base rate at 4% is going to be 2% above the inflation rate. That is a real interest rate of 2%, which is exceptionally high inside the UK economy and will crush growth because when money is that expensive, in real terms to businesses to borrow, they don't borrow as much of it, simply and straightforwardly, and yet - and I won't bother to put the chart up - according to Rachel Reeves, businesses are going to invest very heavily over this period. And frankly, I don't believe it when real costs of money are that high and mortgage rates are going to be even higher.
Remember, a 3% real mortgage cost, - when we have lived for a long period of time until very recently with negative real costs of borrowing to buy houses – means people who are now borrowing to acquire their homes are going to be punished over the next five years in a way that is almost unimaginable as a consequence of these changes in interest rate that are being forecast by the Office for Budget Responsibility.
But there are more perversities coming out of this forecast. Let me move to the next chart, which is the savings rate.
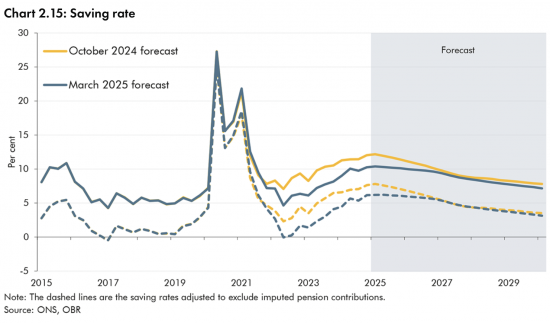
Now the savings rate shows the overall part of income of people in the UK that is saved during the course of a period. And the critical figure here is actually the top blue line of the forecast. Ignore the yellow, look at the blue, although it's pretty much similar to the yellow, frankly, during most of the forecast period. But what you will note is that the savings rate is going to fall between now - when it is at around 10% of total income - to a figure that is, well, more like seven or 8% over this period. We won't get too worried about the detail, and I haven't actually managed to note the precise number before making this video. But the critical point is that despite these exceptional real interest rates, which are apparently going to be on offer, or at least are going to be charged to mortgage borrowers, people aren't going to save more.
That makes no sense because real interest rates should increase the savings rate, and yet UK households are apparently not going to do that. So, there is a complete paradox in here. This is illogical.
The previous charts do not and should not lead to the conclusion in this chart unless we go to the final chart that I want to show you, which is this one, and this is probably the most complicated chart in technical terms in the Office for Budget Responsibility report, but let me explain what it is.
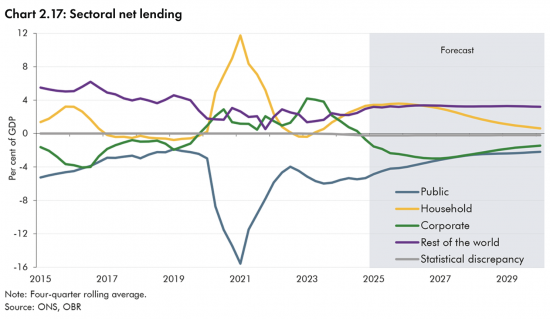
It is called the sectoral net lending chart, and it is based upon a simple statement of fact, which is that for every lender, there must be a borrower. This is, of course, what double entry requires, and this is, of course, what the realities of money lending require.
Whenever you borrow from a bank, they lend to you; you borrow from them.
If you borrow from somebody else, they lend to you; you borrow from them.
This is what double entry in reality looks like. And this chart shows how the overall performance of lending and borrowing within the UK economy should progress over the next five years.
The lines that are below the middle zero line plus the lines above the middle zero line should always add up to zero because that is what double entry requires, and what you will see is some very strange movement here.
First of all, let's just look at that yellow line because that's the household saving rate, which actually is shown to be falling even faster here than it was in the previous chart. I can't explain why this chart is suggesting a different level of saving to the previous one. That's for the Office for Budget Responsibility to explain, but the descent in the household saving rate shown on this chart is actually more stark.
People, in other words, are going to be spending their savings to be able to afford to live. So much for Rachel Reeves' promise that we are all going to be feeling better off. Actually, that's impossible. We will have to use our savings to maintain our standards of living. Rachel Reeves is not telling you the truth about what's going to happen over the next five years, according to this chart.
And as always,s according to the charts produced by the Office for Budget Responsibility, the government is going to borrow less over this period, so that bottom blue line is heading up towards the zero line because that shows the government is going to balance its books.
We know that's a work of fantasy.
They know that's a work of fantasy.
It is not going to happen, but that's what they say to make this equation balance.
They then say that business is going to borrow heavily over the next five years. And the reason why business is going to borrow heavily is that they apparently are going to put all this money into investment to create the growth that Rachel Reeves has promised you as the basis of our future prosperity. But they're not going to do that because there isn't the profitability in the UK economy to deliver that outcome. I promise you that is not going to happen. But that is what they say is going to happen.
But the most interesting line here is the purple one. The purple one is the rest of the world. That means literally everybody who saves in pounds sterling, but isn't resident here.
There are lots of people who do that. People who use the City of London to deposit funds, people who are making a trade surplus with us who do not want to be repaid into their local currency, whatever it might be.
There's a lot of Chinese funds here. There's a lot of people who buy property in the UK. They leave their money in the UK economy. What they've earned stays here, and that is forecast, if anything, to increase and become the biggest source of savings by a long way inside the UK economy over the next five years.
Now that's weird because okay - I accept that did happen before 2019. You can see that on this same chart - but the forecast, it means that basically we are going to be dependent upon the favour of foreigners. I've got nothing against foreigners. Let me clear, but this is not a stable economic policy, but it does explain all the previous charts.
The government looks like it is hoping that there will be a high-interest-rate policy in the UK, and there are two reasons for that.
If there's a high-interest-rate policy in the UK, foreigners will bring their money here, and the government will need to run a smaller deficit as a consequence, simply because that is how the equation has to balance. But UK households will be dissaving because they won't be able to afford to make ends meet because they'll be paying such high interest costs and, therefore, we'll be paying money to foreigners at high interest rates to induce them to bring the money here and we - that is the people in the UK who borrow money in particular, those with mortgages or those who pay rents to subsidise the mortgage costs of their landlords - will be being penalised so that we can pay high interest rates to the people who want to deposit their money in sterling from outside the UK.
We are literally going to be bankrupting the poorest people in the UK economy to make rich foreigners wealthier.
We're going to see money leaving the UK economy to make these people richer as a consequence of running a high-interest-rate economy well out of line with the rest of the world.
No wonder Rachel Reeves is so keen to keep the Bank of England and the City of London happy right now, because she sees them as the source of the funding that is going to keep the UK exchange rate in control as a clear indicator of what this really means.
This is not a viable economic policy.
It is not viable for the people of the UK.
It is not viable that we should be so dependent on hot money, which is effectively what that purple line is.
It's not viable that we should be paying so much interest out of the UK at a cost to the people of the UK.
It's not viable that we must run a high-interest-rate policy to maintain the value of the pound.
Nothing about this suggests that Rachel Reeves is in control of the economy. What it does suggest is the exact opposite. It suggests that she's panicking, and the only way she can think of the economy balancing is by literally having to borrow from foreigners who are going to leave money in the UK because we're going to have such high interest charges.
That's not an economic policy. That's a way to bankrupt the UK, and she needs to change her plan or go because this is bad news for everyone in this country.
Thanks for reading this post.
You can share this post on social media of your choice by clicking these icons:
There are links to this blog's glossary in the above post that explain technical terms used in it. Follow them for more explanations.
You can subscribe to this blog's daily email here.
And if you would like to support this blog you can, here:

 Buy me a coffee!

I think that you’ve made an important discovery here – this is totally Thatcherite to be honest and also proof that the money producing capacity of the government is being wantonly ignored by the Chancellor who should know about it.
It would be bearable if we had a selection of interest rates for different uses of money but as we know, the interest rate is just hammer to crack a nut.
One of her predecessors used the power of that money to bail out private banks and the rich in 2008, so we know that power exists and instead , Rachel from Accounts does this?
Unconscionable.
Or, if I may speak more plainly ‘F**k off Ms Chancellor and thanks for nothing, duck’.
At the expense of making a variation of a comment I made yesterday and allowing for the fact that the forecast is clearly nonsense why isnt the Government proposing to tackle the forecast house price inflation – isnt inflation supposed to be a bad thing?
Isn’t it the case that interest rates higher than other countries normally result in a commensurate decrease in the value of our currency, thus levelling the playing field? So return on investment for foreign investors will be no better than for investments elsewhere; all that Reeves’ policy will result in is a decrease in the value of the pound, which will feed through into inflation. Have I missed something?
Maybe…
I have no idea from what has been written as to what the plan is
But it feels dangerous in its incoherence
If what you stated is the case, the currency-markets aren’t thinking the same.
The £ has rallied since yesterday and is near-equal to a 6-month high, after initially dropping when Ms Reeves sat down.
Perhaps the money-markets know/show what Reeves and the OBR refuse to admit; garbage-in, garbage-out? If I may borrow our esteemed host’s favourite description of GERS, what Reeves has claimed/forecast and what the OBR has forecast, as consequent, amounts to rather a huge dollop of CRAP?
The money markets know?
Pull the other one.
“Nothing about this suggests that Rachel Reeves is in control of the economy….etc”
She is following orders. I do not think she is panicking – she is doing what she it told. & her actions amount to a slo-mo dismantling of the UK state, by stealth. Working on the basis that most Brtis when they voted for LINO did not vote for this, then this means that she is also a liar.
However, I suggest that it is much worse than that: she is an enemy of the British state – which she is dismantling so that the likes of Blackrock & others can make a profit – for the already rich. This is treason, plain and simple.
I entirely agree. Ever since I started trying to make sense of the socially destructive policies of the Celtic Tiger cartel here in Ireland in the mid noughties, trying to follow where the sudden vast easy island wide Irish wealth came from and where it was going, finding the trail of the triple trick of pass the debt parcel global hedgefund CDOs just before the music stopped in 2007/8, I have been closely watching their next moves. For personal survival as well as political interest. These self appointed Masters of the financial Universe (Mandelson?) have never been held properly to account for their careless criminal abuse of capitalist societal powers purely for personal financial gains. Starmer and his so called government are simply the next iteration of Border Reivers by another name.
Thank you, Sara.
I had a ring side seat from 2007 – 16 and agree with you.
In 2013, I heard first hand from an outgoing deputy governor and chief economist of the Bank of England that the impact of 2008 would be felt for another 20 years. They explained how. I agreed.
Thank you and well said, Mike.
Mike is right to brand Reeves an enemy of the British state and mention BlackRock. The US firm was involved with preparing the statement.
City trade bodies, including my former employers, submitted ideas, just like for last autumn’s budget, but US firms are firmly in the lead, even more so now. There are rumours that BlackRock and Brookfield, a Canadian firm that employed Mark Carney, are eyeing the break-up of aristo estates*. This will enable Labour leaders to settle scores with upper class types they feel slighted them at Oxbridge and sell it as social reform to Labour voters. The idea came up as the Land Registry is undergoing reform. *Farm land, obviously, but their urban or near urban estates**, too.
Thanks for setting that out Richard. So I guess the conclusion is that Rachel Reeves is even more economically illiterate than we thought, and that was pretty bad. It also looks as if the OBR charts are a work of fantasy based on some odd assumptions. As for more foreign investment in housing thats not what we need as it will push up house prices and restrict demand but if you want people from outside the UK to invest that is probably what will happen! She should go, she might be ok being an office clerk under supervision in some company where she would be out of (our) harms way.
I hadn’t previously realised this was a “thing”(as they say).
https://www.pressreader.com/australia/the-guardian-australia/20250327/282376930379549
Thank you. Yes, it is a long post; yes, it is a bit technical and yes – it does matter!
45 years ago I used to fake my results in Physics Practical classes. Rather than do the experiment badly (as I was pretty hopeless) I would spend the lesson making up the data and writing it up so that I had less (or no) homework in the evening.
Faking something is actually quite hard as everything has to be consistent but not perfect… and I feel that the OBR has failed.
First, they have started with the results they want – government borrowing meeting the “fiscal rule”.
Second, they have then taken a BoE inflation forecast which, unsurprisingly, is ALWAYS 2% in the medium term (after all, if that was not the forecast someone might suggest they should change policy to meet the target).
Third, they have selected a growth forecast that is “as good as they can get away with” (when compared with other forecasters).
So far, so good…. but they have failed to “fake it” properly because their Base rate/gilt yield/house price forecasts are totally inconsistent with deficit/inflation/growth numbers they have picked out of thin air.
The revered status in which the OBR is held is really quite bizarre.
Thanks
Appreciated
What might a sensible, medium term interest rate forecast look like? FWIW I would suggest
Base rate at 3% (ie. in line with forecast nominal GDP growth)
10 year Gilt yields at 4% – ie. 1% above the cash rate but lower than today’s gilt yields.
I have pondered where they get their forecasts from; I think it possible (and it may even be a footnote somewhere in their report – but I am not going to pore through it)) that they are using “market, forward rates” as their forecast.
If you know todays 10 year rate and today’s 15 year rate we can calculate an implied 10 year rate starting in 5 years time. This is superficially very attractive as it requires no judgement and when we challenge it they could reply “It’s what the market says”. However, empirically, we know that this is not a sensible forecast. The yield curve is nearly always gently sloping up which suggests that the market is always expecting higher rates – which, over the long run, nonsense. If you must take a market number for your gilt forecast then use today’s yield. Historically, it would have been more accurate than the forward rate (both being pretty useless!).
Thanks
Thanks Clive. I too, as a short cut, used to fake my results but found that it was difficult for them to pass the smell test so actually reverted to doing the physics experiments. I ended up enjoying the subject for a lifetime.
Just so for Reeves it would be simpler to run the economy for desirable social and economic outcomes than to run a sterile show dictated by her backers. This is the problem Labour (and other parties) turn away from, designing policy for a post industrial economy and a future for all citizens not just the Masters.
I studied (and enjoyed) “Physics for clumsy people” – or Maths as it is commonly called.
What makes this really sad is that, in fact, most people who work in finance recognise that the voters voted for better public services; most of them expect higher taxes and are prepared to pay. Most are more concerned about Badenoch/Farage getting behind the wheel than paying a bit more tax.
Unfortunately, the psychopaths that get to the very top in this industry (and, yes, many at the top would meet this medical definition) get all the coverage and bully the Chancellor into a particular policy that is designed to preserve their monetary wealth (at the expense of the commonwealth).
Thanks
With apologies, I’m going to quote in full paragraph 7.12 from the OBR report, which sets out the OBR’s assessment of the likelihood of the government meeting its fiscal rules.
Rachel Reeves gives the impression that this is a certainty but the OBR’s analysis gives a more nuanced answer.
“ 7.12 Fan charts, based on stochastic simulations and historic errors, allow us to assess the probability of the Government meeting its current budget and PSNFL fiscal targets based on previous shocks and forecast errors, respectively. Chart 7.4 shows the probability distribution around the forecast for the current budget and PSNFL. It shows that, based on currently stated government policy, there is:
* a 54 per cent chance that the current budget is in surplus in the target year of 2029- 30; and
* a 51 per cent chance of public sector net financial liabilities falling as a share of GDP in the target year 2029-30.”
51 and 54%. All of that human pain to meet the demands of her mechanical spreadsheet, and the likelihood of the desired outcome is little better than the toss of a coin.
Thank you
And much to agree with
“The revered status in which the OBR is held is really quite bizarre.”
Tell me about it ….
What is even more bizarre is the continuing status of economists; as experts on the workings of, eh, um … the economy. Beats me, as they know virtually nothing about how an economy actually works, and possess no functionally effective methodology to make real world predictions, or test their preposterous theories.
Much to agree with
Mr Parry, you missed out a forth point ref the forecast. Chickens.
Specifically chicken entrails – which they read & then misinterpreted & thus got it all wrong.
Thus are their chickens coming home to roost, as it were.
🙂
Arghh! Knew I forgot something. Chickens entrails, of course.
As the old gag goes… why do we have Astrologers? To make Economists look good.
🙂
Is one allowed to ask the OBR “What evidence do you have for your ‘forecasts’?”
Are they evidence-based?
Are they merely a guess as to what will happen?
Are they what the OBR hope will happen?
Are they what the OBR have been told Reeves wants to happen?
Or are the OBR warning Reeves what will happen if she doesn’t change tack?
You can ask….
Great post, clarifies everything.
I’ll only nitpick the bit where you say ‘no wonder Rachel Reeves is so keen to keep the Bank of England and the City of London so happy right now… she sees them as the source of the funding…’
I think Reeves sees no such thing.
The chancellor hasn’t got the first idea where the Treasury and OBR have led her.
🙂
Thank you, Richard.
With regard to foreign money, in December 2017 and March 2018, Mark Carney warned about Britain’s “dependency”, especially after Brexit, “on the kindness of strangers”. Bank of England staff also wrote about it as per https://www.ft.com/content/0d834da3-f6f3-30d1-986d-b8a16eab7a5a, but disputed their boss’ contention. It was being talked about in any case.
With regard to housing and house prices, over the past dozen years, I have noticed the rise in multi-generational dwellings where I live and have heard similar from friends and colleagues. Many friends and colleagues have children well into adulthood living with them.
Yesterday, Sky News wondered why the birth rate was collapsing. It was phrased as why are British women no longer having children. BBC breakfast news went better this morning, though. The business correspondent said tax receipts from economic growth fund the government and had an economist from Experian to echo chamber that.
Was that Simon Jacks? He is hopeless.
And re the birth rate, glucose dramatically reduces sperm counts – and are prevalent in ultra processed ceased foods.
Thank you, Richard.
The equally hopeless Ben Boulos.
Jack did not last long in banking :-).
ref falling birth rates.
This is a Europe-wide (indeed Japan & Korea & China) wide phenomena. One could characterise it as women, voting with their wombs on neoliberalism. Obvs the full effect of neoliberalism took some time to get a grip but now we can see the full effects. Italy – native Italians? declining by ONE MILLION per year. Poland? – 0.25 million less native Poles per year. Even Sweden – famously child friendly – has problems. But, within the big picture stats – all is not doom & gloom. Some societal sgements of doing well. I will leave readers to guess which – with the observation that they are very socially cohesive. However, social cohesion and the bonds that used to bind us Europeans have been dissolved, by neoliberalism – we are all now “consumers” – working well isn’t it?.
Thanks Richard for the explanation and analysis. Is it not time to rename the OBR as the Office for Budget Irresponsibility?
I have intentionally used a nom-de-plume because, like you, I have just retired from a life working as a lawyer in the planning, development and environmental law fields. I feel that, for client confidentiality purposes it is best that I maintain a measure of distance between my personal and professional views, (call it, if you will, plausible deniability!) but I can predict with certainty that all the talk of getting the homes built will come to naught. I started out in practice when the one main statute was the TCPA 1971. Since then there has been the consolidation act – TCPA 1990 – which, curiously “consolidated” the Act into 4 separate Act and numerous subsequent amendments. My hard copy of the Encyclopaedia of Planning Law has ballooned from 1 to 9 volumes! That says it all. I also co-authored a book on the changes brought in by new Labour in the PCPA 2004 (which were ill-considered, badly executed and, arguably, made the housing crisis worse). On a more humorous note, the Foreword was written by (the then) Mr Justice Sullivan who confidently predicted that the politicians at Westminster will be unable to resist meddling some more. Boy was he proved right!! All this leads me to say that, for very many reasons which I shall spare you from, this LINO government will not deliver anything like the new homes that the nation needs and so any growth plans that depend, in part, on boosting housebuilding will fail abysmally.
Thanks
I am happy fir anonymity in such cases
We don’t need to worry about building new homes, as any young person who is able will leave the country, and those who remain will never have children. It’s a problem that will sort itself out.
An excellent review which I have asked Chat to expand/check without taking it to an ideological conclusion — you can read it here – https://chatgpt.com/share/67e51883-ecb8-8002-80ed-591ac953884f
Thanks
That post may be long but you have done a brilliant job explaining it because I followed the logic all the way through and I am neither an accountant nor an economist, but one of your internet “foundation year” political economics students, who doesn’t even really understand what a spreadsheet is (although I did use them and use pivot thingys while running a foodbank)!
The bit none of us know of course, is WHY?
Is it total incompetence (and how far through government does that incompetence reach?) or is it an arrogant plot to destroy the country to make very rich people richer?
And whichever it is, are the public going to put up with it, and what will we be handed as an alternative?
A change of Chancellor but no change in direction (cosmetic tinkering)?
As above but including a change of PM?
A collapse of government, an election, and God help us, an accelerating move towards fascism?
A change of PM (and Cabinet), brought about by a genuine and dramatic change of heart amongst a v large number of Labour MPs, who are prepared to stick two fingers up to the dark forces of oligarchy and wealth, and do what is best for the most vulnerable, here AND overseas?
To lose EVERY national newspaper editor is quite an achievement. Do I hear another lettuce being prepared for a photoshoot?
Thanks
RobertJ: Your list should also include ‘departure of the devolved Celtic nations from the UK’. With every year it becomes clearer and more obvious to all who live there that UK Governments have been acting incompetently and relegating the interests of the various peoples (including the people of England) behind the interests of big business and idealogical fantasists.
You know my opinion, Ken
That would also require the Scots (I am a lifelong Scots exile) to put two fingers up to Westminster and use the legal power they clearly already have (they ARE a nation after all) to just declare that they ARE going to hold a referendum and make the move whatever Westminster thinks. Of course the issue of Faslane does complicate that although I don’t think the Westminster government is ready for a war with Scotland involving actual troop movements. But who can tell?
These are definitely uncharted waters.
Labour MPs who don’t understand the mess they are creating really do not deserve our sympathy. If they can’t see it now, they never will. There is no excuse. “We were simply obeying orders…”
No coincidence perhaps, that the day before the budget it was announced that the Lower Thames Crossing (…..currently costed at £9 billion) had been given the green light. It’s anticipated that half the funding will come from the private sector. ‘Model to be determined’.
There are important assumptions underlying the OBR forecasts which are not being made explicit. Reeves big idea provides one likely key. Private Finance Initiative Mark 2. Big money for big projects.
There has been a trail of breadcrumbs since before the General Election.
In her big speech on 29 January Reeves vowed the go ‘further and faster to kick start economic growth’ highlighting planning reform and some of the major infrastructure projects ‘Britain so desperately needs’, including a third runway at Heathrow. She said major infrastructure would be delivered by the ‘Development of funding models that can unlink private capital alongside government capital, as well as private sector innovation and risk, could stimulate development of critical assets and drive economic growh. This includes demystify the use of the PFI model and learning from successful examples…such as the Welsh MIM (Mutual Investment Model) structure.’
A MIM differs from PFI in that the public sector is a shareholder, has more input into the contract and along with other shareholders benefits from any ‘profit’ made.
Ahead of Reeves growth speach, on 28 January, there was a joint Downing Street and HM Treasury announcement on pension reforms including new rules giving more flexibility over how occupational defined benefit pension schemes are managed and invested. Eyes on £160 billion of scheme surpluses which require high interest rate to maintain. This built on November’s Mansion House speech which spoke of collectivisation to create fewer, larger pensions funds
Overall approaching £3 trillion is held in UK pensions savings, most of this invested overseas.
This all feels Labour’s (City approved) ‘Plan A’ (speculated upon here last Summer). Facts since have changed.
Private money is _always_ more expensive than public borrowing. And we all know that if the brown stuff ever hits the fan, private money will bail out, leaving the government to pick up the pieces.
Reeves is not thinking straight. Which is what happens when you have been brainwashed.
£9 billion for another Thames crossing, while the north east cannot get confirmation of the promised £6 million to finish repairing the Tyne Bridge.
https://www.chroniclelive.co.uk/news/north-east-news/north-east-staggered-backing-9-31284916?fbclid=IwY2xjawJSPg9leHRuA2FlbQIxMAABHbDo3tT1lsxz54CH_KWBqOzQDh7Ih8r57aOiA22B-HOxtGWQ5tVv8K7FrA_aem_E7068loSBJsuyebFOwWHIA
The response to Liz Kendall’s welfare cuts was moral outrage backed by hard facts, personal testimony and statistics from those at the sharp end.
The response to Reeves’s crisis austerity “spring statement” is more one of fully justified incredulity by those with the skills to do the maths and work out that the numbers simply don’t add up.
Can one be morally outraged at the same time as scratching one’s head in puzzlement while faced with a pile of garbage pretending to be economic policy?
What a fascinating summary and analysis of the Statement. Thank you
If I may suggest that, very near the end, “It suggests that she’s panicking, and the only way she can think of the economy balancing is by literally having to borrow from foreigners who are going to leave money in the UK because we’re going to have such high interest charges.” gives her credit for this Machiavellian plan.
I suspect that she has read the script and set an aim for those advisors and the Civil Servants in the Treasury and BoE (as the BoE must be on board with all this, they could simply blow it away by dropping interest rates too far- I wish they would and hope they do).
Her aides have produced this, and I do wonder if she knows what she has done and the effects it will have on the general population? Something makes me think she hasn’t a clue.
I also wonder if Starmer has any inkling too. He really does need to get a Chancellor who can think and not lock themselves into meaningless fiscal rules. But then, maybe he, too, believes they are essential. If so, only grass-roots inspired pressure for change at the top might provide the relief needed. Now I’m in fantasy-land …
Thanks
Coming of age in the 60s I can remember times when interest rates went up to stop foreigners removing their deposits from London. It was the era of fixed exchange rates but there was still a possibility of devaluation. Harold Wilson came to power in 1964 and refused to devalue. With a year or so we had extra taxes, and if my memory is correct, a 15% extra duty on goods from EFTA of which we were a member.
As the Cold War had cooled Labour made the decision to keep defence spending at two billion in 1965 prices.
I can remember industrialists complaining that higher interest rates made it harder to re-equip with modern machinery to compete with Europe. I worked in factory for most of 1965 and much of the machinery was WW2 Lend-Lease ! But the City trumped industry. I think that has been the case for at least a hundred years.
Inevitably we devalued in 1976, a tight budget from Roy Jenkins and a year or so later a govt surplus. And Labour lost the 1970 election.
It all seems familiar.
In some ways we are also repeating 1931 with Labour following the bankers recommendations at the price of the poor. They even wanted to cut the dole leading to some of the Labour cabinet resigning and McDonald going to the King to offer his resignation. KIng (who advised him I don’t know) George V asked him to stay on and head a National govt. That govt turned out to be mainly Conservative with some Liberals and a few ‘National Labour’. The cuts went through and we had the Depression, the rise of Fascism, mainly abroad, and the measures didn’t work very well.
They say those who forget their history are condemned to repeat it.
devalued in 67
sorry
This is such a valuable analysis – why aren’t the independent think tanks or Economic departments doing this?
Both the IFS and NIESR do query the whole approach Reeves is taking and indeed the kind of fiscal rule that may be appropriate, but so far haven’t had a detailed ctitica look look at the OBR’s forecast.
The contradiction between base interest rates, and future mortage rates and bond yields and savings rates etc is eye opening.
But if as you say Richard, the whole edifice relies on attracting foreign ‘investment’, by deregulating etc – – through what some have called a classic ‘third world’ strategy which has messed up so many countries in the global south – it will make us even more subject to global corporates, US policy etc.
Thanks
Is it worth sending this post to the chair of the Treasury select committee which meets next week? Paul Johnson is giving evidence, but I notice Richard has not been invited.
Please do
Better than coming from me
Thanks for the analysis Richard; it was fairly understandable even for me as an economic illiterate. On a related matter, Richard Tice, the Reform Party MP, interviewed on C4 News the evening before the Spring Statement, stated that the BoE could reduce their borrowing costs by cutting the interest rate they pay ‘which is voluntary’ I know this is something you’ve often pointed out but it’s the first time I’ve heard a politician express it publicly.
It may be the only thing we agree on
It seems to me that despite interest rate rises , house prices are set to rise. The reason for this is the yield that the rentier can extract. This is almost always missed in analysis of house prices. The solution, rent controls. I would be interested in hearing your thoughts on this Richard.
Noted
I will add to my list
That final chart is interesting. It does look as if the OBR has set the “net rest of world line” as flat (because how would it know what is happening in the rest of the world?) and using that fixed value to model the other values. Basically it’s assuming “ceteris paribus” for the rest of the world. Now, if the UK government decided to implement capital controls, then it would have some control over this variable. Presumably the increase in property prices is because of capital flows into the UK to purchase real estate- one of the reasons for the property price boom and property inequality in the first instance when capital controls were abandoned from the 1980’s.
Rising house prices and higher interest rates? Just like old times; it’s almost as if someone is fulfilling a promise made to their banking pals in the immediate aftermath of 2008.
I usually stick to your transcripts but, given the length and depth of the subject matter, I watched the video for the first time in a while, alongside the transcript. The production and presentation are superb —very professional.
Thank you.
I just look into the camera, and talk. Admittedly, I seem to be able todo that. And this one, very obviously, took some late afternoon / early evening planning. I also funded a good camera and lens and I really like the microphone we are using now. But Thomas’s role is key. He decides if what I have done is good enough. I don’t. And he then has to correct my mistakes, add the overlays and dp all the tech stuff. He worked late on Wednesday. He seemed to think it was worth it. We’re taking most of today off as TOIL – time off in lieu.
In response to RobertJ at 9.12pm:
I agree with you that we Scots will have to initiate secession from the UK as Westminster governments are always going to say No. My gut feeling is that 2026 may be a pivotal year: we’ve got Holyrood elections next year and the trend of polls shows an increasing majority for Yes once Don’t Knows and 2014 Weighting are removed (most polls adjust their outcomes by applying outdated weighting which no longer reflects the current demographic; when such weighting is removed the figures for Yes rise to c60% or above).
2026 also gives Labour plenty time to screw up UK governance and the economy, which I reckon to be likelier than them turning it round. Also, the continuing move in N Ireland towards re-unification coupled with its in-built facility to stage their own secession referendum could be enough to push the SNP into staging the Holyrood elections as a referendum on independence.
Richard, thank you for this analysis. I’m sure over the next few days we will hear more from others.
What surprised me is they could have waited till Autumn but they didn’t.
They felt compelled to show they were sticking to a budget and forecast. When everyone knows that things are bound to change for all sorts of reasons.
I wonder why they decided to be seen to do something now in March.
Why pick a fight when you don’t have to?
Intriguing.
Thank you Mr Murphy, pretty clear even to me, ignorant of economics. I have learned so much from your blog and videos, and now realise why trying to read the odd economics book in the past was so perplexing. What do you call the tax reforms you propose, which are not a ‘wealth tax’ but are so very practical? I keep referring people to your tax report, but I don’t know how to describe it correctly. Many thanks.
It’s the Taxing Wealth Report – without a wealth tax.