The Office for National Statistics issued its latest public finances data this morning, including this chart:
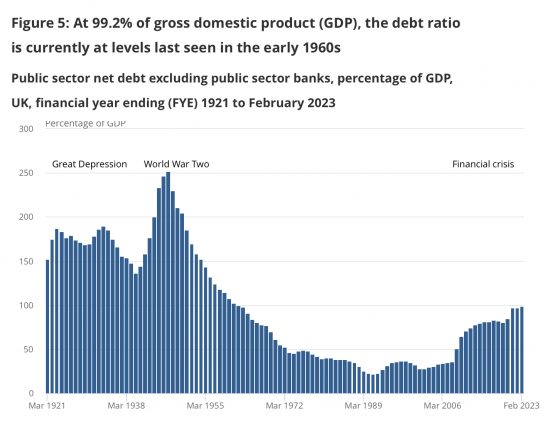 Let's ignore the fact that they include more than £800 billion of debt owed by the government to itself in the debt figure, making any claim that the ONS might make as to credibility laughable.
Let's ignore too the fact that the national debt figure includes about £200 billion of debt supposedly owed by the Bank of England which you will not be able to find on its balance sheet.
And let's also ignore the fact that more than 8% of GDP is a wholly made up number representing rent owner occupiers of houses supposedly pay themselves for the privilege of living in their own homes.
In other words, let's ignore the fact that this ratio compares a false figure with a crap one.
Let's just ask instead what the purpose for highlighting this is?
Is it to say the debt is unrepayable? If so, it is clearly wrong. We have repaid more.
Is it to say we should panic? But why, when debt created such good things in the 50s and 60s?
Or is it to say government is overspending? Is that the job of the ONS?
Or could it be that like the quality of the numbers underpinning it, the ONS really has no clue what this chart is about?
What it actually purports to show is the cumulative government deficit since 1694 against current income. As ratios go that is not very helpful since it mixes time scales.
But what it does not show is debt, because if that debt were to be repaid money would have to be created to pay it. And money is of course just debt. So, in effect, it is unrepayable except by taxing it out of existence. I doubt anyone is suggesting that.
So, what this chart actually shows is how much money the government has cumulatively injected into the economy and not taxed back. It is, therefore, a measure of government created money.
So, the right questions to ask are:
- Can we do without this money?
- When banks are clearly failing, again, shouldn't we celebrate the fact that we have this money?
- Could we do with more of this government money?
The answers are no, yes and yes.
But the ONS does not understand that.
It is really not a very good statistics authority. A good one would understand why it is producing data, get it right, and ask meaningful questions of it. The ONS fails on those criteria.
Thanks for reading this post.
You can share this post on social media of your choice by clicking these icons:
There are links to this blog's glossary in the above post that explain technical terms used in it. Follow them for more explanations.
You can subscribe to this blog's daily email here.
And if you would like to support this blog you can, here:

 Buy me a coffee!

I have been extremely sceptical about supposedly fundamental economic statistics ever since what happened in the 1970s and 1980s.
At the time the great indicator of national economic health was supposed to be the balance of payments.
In 1976 the then Labour government was told by the Treasury that there was a catastrophic hole in the Balance of payments and that the only option was to ask for an IMF loan and start replacing Keynsian policies with Neo-Liberalism. It panicked and did as it was told.
Within months it was informed that the Treasury figures were completely wrong and there was no catastrophic problem. As a result the IMF loan was paid back in record time but the policy changes remained in place. The only debate was whether the whole affair was a cock-up or conspiracy. William Keegan, the Observer columnist, has always said that at the time a very senior Treasury official told him “It doesn’t matter whether it was a cock-up or a conspiracy, the important thing was we forced the Labour party to do the right thing”.
A decade later with the ongoing Thatcherite economic disaster in full swing and the balance of payments in a genuine mess, the Tory Chancellor Nigel Lawson simply declared that the balance of payments no longer mattered.
So much for status-quo economics and its established statistical shibboleths.
Political economy seems to be bedevilled by lies, damn lies and statistics epitomised by Boris Johnson, all chancellors, the ONS and the MSM …..
My search for understanding money, where it comes from and how it could be used to create a more fair and just society has greatly improved as a result of this blog.
Thank you Richard for enjoying the challenge of using critical thinking to unravel these complexities.
Mr Langston,
i have some reservations about your balance of payments thesis (… in passing, I am not sure I would rely on Nigel Lawson as a fount of wisdom, but I acknowledge that is beside the point). I am sure the balance of payments does not matter, too critically for the US. The US is, however in a quite different position. The UK? Not when we were the leading industrial and commercial power; but that is long gone. Not for neoliberals, but they assume in Britain financialisation and banking is the golden goose; which – please note – is not delivering for ordinary people, who can’t financialise their cost of living.
The problem is, that in the 21st century Britain is in relative economic decline in a new ordering of the world, around bigger economic battalions (US, EU or even the EU’s largest constituents, China, India – need I go on, it will grow longer over time); will require some examination of Britain’s capacity to earn a surplus on trade, because the City of London is running out of time, our industry is on the floor, and we require to import most of our standard of living. We claim to be essentially a trading country, first; trade matters to our prosperity.
Over the last two years the trend line of Sterling (£), against the US dollar over 1 year is downwards from around 1.40+/- to 1.20+/- a few cents (take 2-years, or 5-years, it still holds). The problem is, we import a lot of food, commodity goods and manufactured goods to sustain our standard of living (because we have a weak so-called ‘real economy’ productive sector); and rely on the increasingly suspect, dubious and unreliable fiancial sector to supply the upside. It doesn’t, and can’t. Its future will be of relative dcline. The export value of services is proving less than Lawson and the neoliberals claimed for it.
One of the reasons I have confidence in Scotland’s independent future in a world found problematic for the UK, is because Scotland has so many natural advantages in a post-climate change world that is so intrinsic to it (nailed down), that the city of London and Westminster cannot purloin it, as it has done with everything of economic value that is not nailed down (including the independent Scottish banking sector, destroyed by Big Bang – they even literally moved the border in the sea in an attempt to purloin the oil). Scotland’s whisky, food, energy, renewables, and some of our younger growing, science-based industries have real potential to provide Scotland with a balance of payments surplus, and a much more secure trading environment with the world for our prosperity; although carrying the whole of the UK on Scotland’s back is beyond us; especially with the prevailing, endemic neoliberal and political values driving the UK into the ground, spurred on by a Conservative electorate that seems to have lost the plot entirely.
I know that this is not entirely relevant to today’s entry but I would like to understand better “debt interest”. It was covered briefly in the entry on 17 March referencing the National spending chart published by HMG. It is presented as some annual payment but in reality (by my understanding) very little is in fact “paid”. Can you provide further explanation or point me to where this might be found?
Please search the site
I gave covered this many, many times of late
Here is the ONS explanation: https://www.ons.gov.uk/economy/governmentpublicsectorandtaxes/publicsectorfinance/methodologies/thecalculationofinterestpayableongovernmentgilts
To quote:
“consistent with international guidance, we record the uplift in the gilt’s principal as an interest cost each month. While the cash measure only records this cost at the point of maturity, the accruals method records this cost at the point the change in liability occurs.
This treatment of the uplift on the principal of index-linked gilts causes large differences between the cash and accruals recording of index-linked debt interest.”
In short, the principal repayable to the holder of an index linked gilt at maturity increases according to inflation. This increased amount is not payable until the gilt is repaid, but the increasing liability is not treated as a finance cost spread over the remaining life of the bond but rather it is counted as “interest payable” and booked immediately. The interest (or “coupon”) actually payable to the holder of the gilts every six months also increases by reference to inflation.
Even just taking the figures at “face value” (usually a bad idea, becuase it is designed to direct attention not to the debt, but to a ‘norm’ they wish to assert). The graph is appallingly misleading. You would think from it, that the ‘norm’ it asserts (that the ratio is <100%) establishes that history shows that the extended periods the ratio has been below 100% is the 'norm'. This is highly misleading. This is not the history of Britain.
Over the long term, the last three hundred years we have possessed a measurable and relevant debt history, including the long period up to WWI/WWII, and for the time Britain was the leading industrial and financial power in the world; Britain's Debt/GDP ratio was almost invariably at least 100%, and often, and for long periods not only over 100%, but over 150% and closer to 200%. The recent dip in the ratio below 100% is more an anomally than a standard; and represents a Britain in economic decline and retreat. These are the facts. The neoliberals specialise in window-dressing. The whole neoliberal debt argument, with no context, just an obsession with debt (for reasons that have nothing to do with debt, but frankly to con the public), is a basic 'straw man' argument.
I thought the Reinhart-Rogoff farcical study on the importance of the debt to GDP ratio blew this sorry sort of thinking out of the ater years ago…how does it still survive?
We need a wooden stake driving through the heart of this particular myth. For example Japan’s ratio of debt to GDP hass been over 200 % since about 2009 and currently in the region of 260 % according to the IMF.
This is all part of ‘project fear’ concerning the justification of austerity to me and that ‘all debts must be repaid’ that results in ‘politics of eternity’ as named by Tim Snyder.
This from The Guardian today is off topic but very interesting nonetheless:
‘…in the UK specifically, something else should be more material to the MPC’s decisions – something that has gone entirely unnoticed. Wage growth has ground to a halt. Private sector pay, far from spiralling, has instead flatlined since November. The future path of wages in Britain remains very uncertain, but looking back over recent months the picture is very different from that often presented.’
Indeed
BBC are at it again, in their so called article on government debt https://www.bbc.co.uk/news/business-50504151 it doesn’t say who the author is. This an absolute classic quote:
“Most economists and politicians agree that debt cannot keep growing forever, because at some point it becomes impossible to pay the interest.”.
Obviously know nothing about FIAT currencies.
Agreed