The Electoral Reform Society has done a Wordle (as think they are called) of the given names of those standing for election on 12 December:
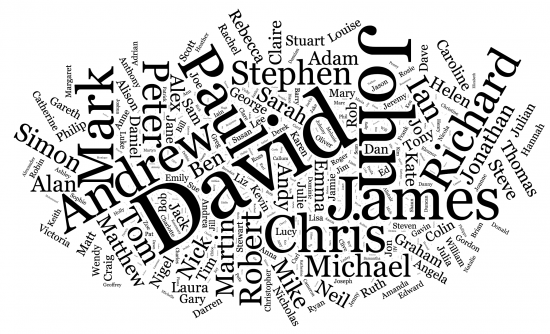
One-third of candidates are female. The top 21 are male.
So not only are women hard to spot, it may well be that the males fit a particular norm and the women don't.
And yes, I know I seem to have one of the more popular male names.
Thanks for reading this post.
You can share this post on social media of your choice by clicking these icons:
There are links to this blog's glossary in the above post that explain technical terms used in it. Follow them for more explanations.
You can subscribe to this blog's daily email here.
And if you would like to support this blog you can, here:

 Buy me a coffee!

One has to ask why so few women stand as independent.
You can’t blame the selection process!
Peter Dawe says:
“One has to ask why so few women stand as independent.
You can’t blame the selection process!”
Hmmmm…..? What proportion of male candidates stand as independents? UK Gov page suggests 19 male vs 5 female. In the entire 2019 parliament….
I suggest that standing as an independent is not easy…without a party ‘machine’ canvassing would be immensely arduous and likely to not to be successful without the sort of (probably single issue) status of a Martin Bell. Some of the ‘renegade’ Tories with a long established reputation in their constituency may be successful, but this is an abnormal situation they are in. By definition there is no ‘Independent Party’ structure.
Ergo…you cannot dismiss the selection process as being the key factor. Not without more information, for example as to how many female candidates actually present for selection. If it’s less than 50% of the total presenting for selection it would be reasonable to expect less than 50% gender balance, but that begs an answer to the question of why the gender balance is not more equal ….(?)
I think we know some of the answers. The issue is not a new one.
Thanks for finding out the 19 to 5 ration of men and woman independent candidates.
I fancy the ratio would go up further if you included “parties” where there is no selection process. E.g. MRLP
The difficulties of standing as an independent are the same for all genders. I’ve stood as an Independent and know!
As a proxy for measuring the propensity for women to enter politics, it as good as you will find. So maybe, the ratios in party candidates are actually biased towards women!
Always fun when (apparent) evidence goes against dogma!
Except you have found no evidence at all…..
The difference is striking, but perhaps it is explicable by the statistics. In short, the distribution of girls names is wider, with a longer tail and a lower peak. And there are twice as many male candidates as female anyway. So perhaps, given the distribution of names, and number of candidates, this is what we should expect. No doubt a statistician could confirm!
The ONS is a good source on first names. https://www.ons.gov.uk/peoplepopulationandcommunity/birthsdeathsandmarriages/livebirths/bulletins/babynamesenglandandwales/2018
As someone with one of those “big” names too, I think it says something about the age of the candidates, and perhaps class too. Most of those prominent male names (David, John, Paul, Mark, Andrew) were nationally very popular top-10 names in the 1950s through to the 1980s. James retained some popularity until the last decade or so, and David has seen a bit of a revival, but the rest are now outside the top 100. In a few decades we might see a preponderance of male candidates with names such as Oliver, George, Harry, Jack, Daniel, Thomas…
Part of the reason, I think, is that more boys are allocated to each of the “top” males names than the “top” female names. So if you look at the 2018 top 100 for England and Wales, available from the ONS, the top three for boys were Oliver, George, Harry (of which there were 5390, 4960, 4512) and for girls were Olivia, Amelia, Ava (4598, 3941, 3110). Generally, for the top 20 names, there are about 1000 more boys than girls in each position (so number 20, there were 2741 boys named Theo but only 1902 girls named Evelyn). Even down at the 100th name, there were 634 boys named Kai versus 522 girls named Felicity.
Thanks!
I was careful to point out in my posting, it was a proxy measure.
By all means make the case why you consider the evidence is (too) weak.
By all means offer alternative evidence.
But flat dismissal makes you look rather dogmatic.
I’m just saying that is not evidence about parties, as you claimed
It is evidence women and men may have different political aspirations.
Such as?
@Andy Crow said:
“If it’s less than 50% of the total presenting for selection it would be reasonable to expect less than 50% gender balance, but that begs an answer to the question of why the gender balance is not more equal ….(?)
I think we know some of the answers. The issue is not a new one.”
Indeed.
Women aren’t going into high level politics.
I won’t go into detail as to why that is, it is very well documented, if not well explained.
All I can say is if you look at the casual or heavy harassment and humiliation women in politics have to put up with compared with men, who at times behave like packs of hounds piling up on their prey…it is not surprising.
Men were there first, claim their territory and make the rules to exclude newcomers.
Women need to be tough and armoured to take them on. And they have had, traditionally, other priorities…which unfortunately cannot be reconciled with public ones.
It’s everyone’s loss really.
As unlike in economics which can’t be run like a household budget, a country, like a family, would be better run with a mixed team, with different competences, viewpoints, sensitivities and experiences, reflecting society as a whole.
Oh well.
Give it a couple of 100 years?