Just how rich are the wealthy? In this video, I break down official data to show who truly owns Britain's wealth. From the bottom 10% with virtually nothing, to the top 1% averaging £5.3 million each, we'll see how unequal our country has become — and why we urgently need the wealthy to pay more tax.
This is the audio version:
This is the transcript:
This is the second in our series of videos on the wealthy, one of the most interesting groups in society at present, because they're not paying enough tax. In this video, I'm going to ask a question which most people are absolutely intrigued by, which is, 'Who are the wealthy?'
And the people who are most intrigued by this are the wealthy themselves, and the reason why they don't want the question answered is, they don't want to admit that they're not contributing enough to society because, as a matter of fact, they aren't.
So let's look at the data. Let's ask the relevant questions and then let's come to some conclusions.
In this video, I'm going to be using data which is provided by the UK Office for National Statistics, and I'm not going to try to overcomplicate things because I don't think we need to.
The Office for National Statistics do something quite straightforward with their wealth data, although I have to add straight away that the wealth data in question only relates to 2022, we haven't had an update since then.
When they look at this data, what they do is split the UK into 10 equal-sized groups. The groups are based upon households and not numbers of people, and there are 28 million households in the UK, and so there are 2.8 million households in each of the groups they look at, which are called deciles, with decile simply referring to one 10th.
What they then do is try to work out how much, on average, each of these 10 groups owns split across four asset categories.
Those asset categories are financial assets like savings accounts or stocks and shares or other types of saving instruments; physical property, which includes things like your car, but also your furniture and anything else around the house that you own; your property assets, which, of course, in most, cases simply means your home; and any pension fund that you have.
Those they think are by far the dominant types of asset which each of those 10 groups in the UK has, and usefully they give us information on one other group as well, and that is the top 1% in UK society, but I stress the data for them is a little ropey because they're not very good at answering surveys, and all this information is basically accumulated from survey data.
So what does the data look like?
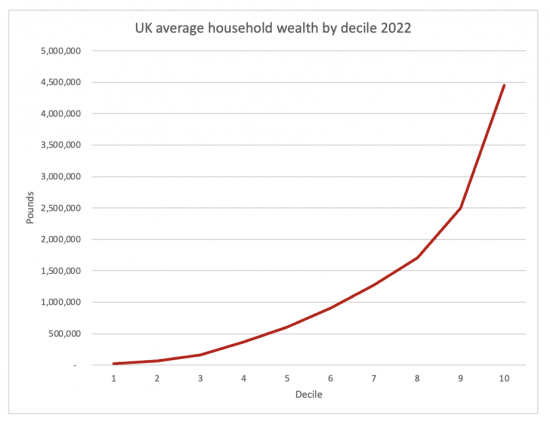
This is the chart of wealth by household on average for each of those 10 groups. Now, if you look at group one, you will see that, near enough, the answer is nothing on the scale that I printed out here, and that column on the left-hand side is an indication of wealth by literally pounds. It starts at zero, which is near enough where the first group are, and it heads up to nearly £5 million per household, in fact, £4.5 million per household, by the time you get to the 10th group. And in between, you can see that the gradient rises steadily. In other words, the bottom half of the population obviously get better off each group you go up, but when you get to the top end, things really accumulate very fast.
But that doesn't tell us very much about who the individuals are who are wealthy, and by and large, we are more interested in individuals than we are with regard to households when it comes to this issue; at least that's my impression.
So I've restated this data, which the ONS has provided on a per-person basis, and there are right now near enough, 68 million people in the UK, although I'm sure not everybody has been counted for certain, and out of those, apparently 14 million are under the age of 18, and let's be honest, most people under the age of 18 don't own very much. So, there are, on that basis, near enough 1.9 adult people in every household in the UK.
So, if we restate that information on data per decile and simply make it now data per person rather than wealth per household, we get a different chart, which is like this. And what that suggests is that, of course, each individual person in each individual decile has less than households do because we've divided every number by 1.9. It's as straightforward as that. And so now we have people in the top 10% having wealth of around £2.3 million each, that's each, and people in the bottom 10% still have near enough nothing.
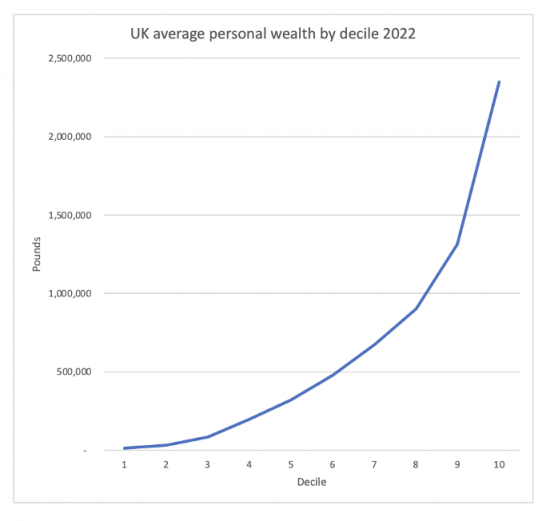
In between, you can see, again, that there's this very steep gradient, so that as you go up the chart, you become ever richer, ever quicker. In fact, let's just look at some of those numbers.
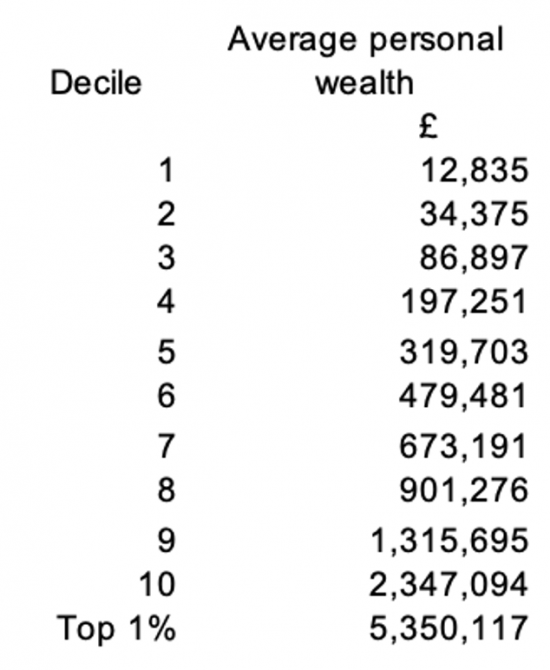
That's the data behind that chart. If you are in the bottom 10% of households, your total wealth is just on average £12,835, and as you will see, almost all of that comes down to personal property and has nothing to do with finance.
In contrast, if you're at the very top, your wealth is near-enough, £2.35 million on average, which does, of course, mean that some people are very much wealthier, and the data for the top 1% shows that they do in fact have an average wealth of £5,350,000 each. But if we look at a typical person, someone who's in groups five or six, because they're right in the middle of this progression, people have an average, well, around £400,000 of personal wealth, but what have they got?
Let's just look at that another way before we look at what people actually have. If you think that the top 1% represent normality - now, of course, they don't, they're an exception - but if theirs is the normal state of play, their £5,350,000 each is the hundred per cent, which I show at the bottom, then, people in the bottom 10% in the UK have just 0.24% - that's less than a quarter of a hundredth of the value that people in the top 1% have. Or they've got 1/400th of the wealth of the wealthiest on average.
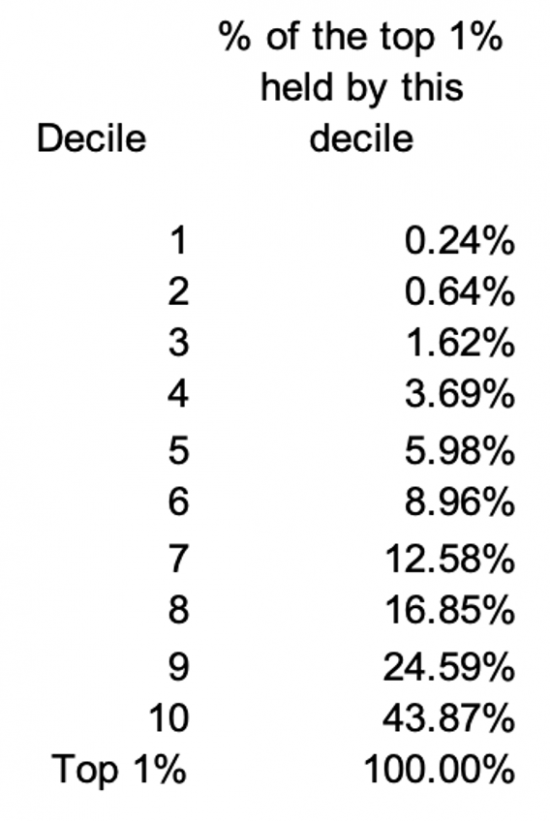
And when we come to the second bottom group, it's roughly 1/200th of the wealth, and when we get to the middle groups, groups five and six, they're running at around oh 1/16th, 1/15th or so, maybe 1/12th at the very top of those bands, of the wealth of the very wealthiest, they've got tiny proportions, in other words, of the wealth of the various wealthiest people in the UK.
But even when they come to the top 10%, they've only got 43% of the wealth of the very wealthiest, so somebody who's wealthy, but only just into that top 10% is only perhaps going to have a little more than 1/3rd of what the wealthiest have.
So what we're seeing is massive wealth inequality. And that's the point I want to make with this slide. We are seeing a country that is heavily divided by the wealth that we have. This is a deeply unequal country.
And that can be seen in a different way. Let's just look at what people have actually got, which makes up those figures for wealth. I know this slide is a bit dense, but let me talk through a few bits of it.
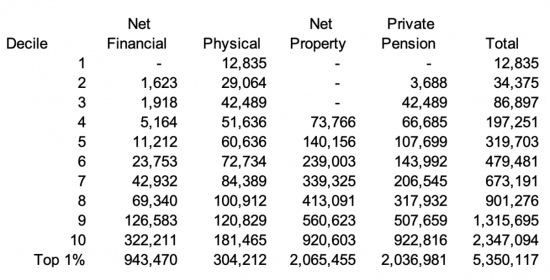
If we look at the bottom 10%, again, you'll see that all the property they have is basically physical property, personal possessions. They have no savings, they have no property, they have no pension assets.
And if we go to the top 1%, you'll see that they have personal financial wealth on average of nearly £1 million, £943,000 according to this data, but you can be sure it's more now.
Their physical assets, their personal property, is worth £304,000 each on average.
Now you might wonder why that has not gone up as much as everything else, but that's because there's a limit on what we consume; we can only have so many cars, and we can only spend so much on them. We can only have so much jewellery before it becomes ridiculous. We can only own so many cameras or so much flash furniture or whatever else.
But then look at the next two columns, the very wealthiest have properties that are worth on average, £2 million, and they have more than £2 million in their pension funds, enough to provide them with a very comfortable income in retirement, vastly more than most people will have ever lived on in their lifetimes.
If we go back to those middle groups, groups five and six again, you'll see that things look a little different. They have a little bit of a rainy day fund. It might be more than £10,000, which for some people is unimaginable, but that is apparently the average between £10,000 and maybe a bit over £20,000 of savings of some form.
Now, some of that may not be a ready day fund, of course, it might be money put aside to cover for saving for a wedding or whatever else it might be that people want to save for.
But it's still a very modest safety net in comparison with their incomes. They can pay an unexpected bill when it comes in, but go to groups four and below, and if that's a sizable bill, that might be stressful for many people.
Their physical property is greater because they're likely to own a house in these groups in the middle, and we can see that they have net property worth. Now, I stress they don't own properties in group five which are worth £140,000. That figure is stated after offset of the mortgage, and that's also true for all the groups. But as you go up the ladder, by the time you get to groups eight, nine, and ten, there's much less likely to be a mortgage, so the net property worth of people lower down the scale is deflated by having very large liabilities, very stressful liabilities, that they've got to pay for periods of 25 or 30 years to clear to create property worth.
And you will also see something else there, and that is that actually pension pots - the funds that are put aside for most people through employment or their own personal savings - are really quite modest until we get up to the ninth, tenth, and top 1% of groups in society.
You are not going to retire in great comfort with a pension pot of £100,000. That's going to buy you, if you are lucky, a pension of £6,000 or £7,000 a year if it's just for you; less if you want to cover your spouse, if you were to die first. And that's true for people, perhaps also in groups six and seven, they've got a pension provision, they're not going to be living in deep poverty, but nor are they going to be living in anything like luxury on those funds.
But once you go up the scale, it's totally different; those in groups nine, ten, and of course, that group of the 1%, they are going to live in relative comfort in retirement. They are well off.
And this is important because, of course, it's that type of measure that we need to take into consideration when we ask the question, what does this mean for who is wealthy?
So, what are we going to look at here, and how are we going to make a decision?
Let's be clear. The top 20% of people in the UK own 58% of our national wealth. That's well over half of our national wealth is owned by a group which is made up of just one in five people.
The top 10%, who are just one in 10 people, own well over a third of all the UK's national wealth. And the top 1% owns an extreme share within that.
What is very clear, as I've said before, and I'm going to say again in this series on wealth, is that we are dealing with gross inequality here. Those who are wealthy might like to pretend that their situation is normal. It isn't, and this is a vital thing to remember when we come to discuss who are the wealthy, because the wealthy, by definition, are outliers. And in fact, they want to be outliers; that's the one thing that the wealthy really want to be seen to be. They want to be seen to be exceptional. So what we've got to define when we come down to deciding who the wealthy are is, who are the really exceptional people?
I don't think that anybody in the bottom 80% is exceptional on those charts. They're normal. Nothing wrong with being normal, but that's what people there are, or they're suffering poverty, as clearly groups from probably four, three, two and one are.
What we can say with certainty is that the 10th decile is probably exceptional.
I'm not sure about the ninth, although they're clearly edging that way; they're very comfortable, but maybe being comfortable isn't quite the same as being wealthy.
With an average of £2.3 million per person, the 10th decile are definitely really significantly wealthy. Just remember, they've got average savings in the bank of £322,000. That totally changes your perspective on life.
There is no bill that's going to arrive that is going to rock the boat, unsettle you or leave you with a crisis. And I think that's sufficient for us to say that this group is definitely one that contains the wealthy in the UK.
Is it all of them, or is it just some of them? Again, let's just be clear about this. The top 1% are clearly in a league of their own. They are very obviously wealthy, and we do not need to subcategorise them. There are some people who say we should only consider people with wealth over £10 million for the sake of considering what is wealth. I don't agree.
So what we have to talk about is looking at where is that cutoff within that top 10% that we are going to draw. And I think it isn't at the bottom of that scale where we're talking about maybe a million or two of wealth.
And it's very definitely happened by the time we reach the top of that scale, where we're talking about £5 million or more of wealth, so it's somewhere in between.
Is it £3 million of wealth that makes you wealthy in the UK?
Is it £4 million of wealth that makes you wealthy in the UK?
You decide, but I think it's somewhere in that area.
At that point, you are in such a comfortable position that your life is completely different from that of everybody else in this country. You are wealthy, and there's no point denying it. You are really, really well off in a way that others can only dream of, and what is more, unless you are very blind to your personal situation, you know that, and you know that wealth is unevenly distributed and that your situation is exceptional.
And in that case, what we have to talk about is the capacity of these people to pay more to live in the society of which they're a part, and to which they wish to flaunt their wealth, because that is essential if we're going to have fairness in the UK.
Taking further action
If you want to write a letter to your MP on the issues raised in this blog post, there is a ChatGPT prompt to assist you in doing so, with full instructions, here. One word of warning, though: please do make sure you have got the correct MP. ChatGPT can get it wrong.
Thanks for reading this post.
You can share this post on social media of your choice by clicking these icons:
There are links to this blog's glossary in the above post that explain technical terms used in it. Follow them for more explanations.
You can subscribe to this blog's daily email here.
And if you would like to support this blog you can, here:

 Buy me a coffee!

The source of the wealth you are referring to is mostly rent of land, primarily urban land.
It is measurable and taxable unavoidably. The Valuation Office Agency collect land values routinely for UBR valuation.
You just made the case for Land Value Tax.
Please don’t remove this comment like you normally do.
I did not make the case for an LVT
LVT can be profoundly regressive – and please don’t spout the nonsense about the landlord paying – because we all know it would be passed on.
LVT would be passed on in situations where a tenant was paying well below market rents. However, the presence of the LVT would tend to drive market rents down as landlords would try to avoid being saddled with the LVT bill and no rental income.
Taken over the country as a whole, LVT charges – LVT is based on rental values, not prices – would be directly related to the prosperity or lack of it in a region. LVT charges in towns on the Durham coast would be very low. Most land value is in property in commercial use, and is already collected, inefficiently and haphazardly, through the business rates which LVT would replace. Commercial land values are also depressed to the extent that the burden of other taxes is passed backwards onto landowners. To that extent LVT is in no way regressive.
That leaves a core of low-income owner occupiers who have purchased residential property in areas which have been gentrified. (LVT should not be based on selling prices which have spiralled due to credit policies, as you know).
There are a variety of mitigation measures which can be taken to deal with the regressive effects that you are concerned about. The macro effect of LVT is a good match to ability to pay. It creates tax havens precisely where they are most needed.
So many economic assumptions based on no evidence at all.
Now, where have I seen all that before?
Thank you Henry. Good explanation within the constraints you were operating under.
Another thought-provoking data-rich blog, it is a good day.
Two things come to mind. First amazement that they could collect that data, if it comes from a survey as you say then I wonder how anyone could respond meaningfully. If someone phoned me up I could certainly check the balance in my savings accounts. But I have little idea what value to put on my house (Zoopla declines to do so), no idea of the cash value of my car and furniture and electronic gadgets, and only an approximate idea of my pension value (I was quoted a number at the point I retired).
The second thing is that the apparent wealth gradient is going in part to be simply related to age; the two effects need distinguishing. When I started work my only wealth was a few possessions, I had no property, hadn’t started contributing to a pension, and had to empty my small savings account to get through the first month (it was a shock to find I wouldn’t be paid until the end of it). Over the succeeding years I saved a bit and bought a flat, most of whose value was the mortgage, and a car. By the time I retired I had forty years of contribution in my pension and the mortgage paid off on our house, which alone would move me well into the top half of your table. Even if someone spent their entire working life in low-paid non-pensionable jobs they would end up entitled to a State Pension which (based on your estimate of income from pension value) would be equivalent to a wealth of around £200,000. I am not sure how you would set about normalising figures for wealth, but I bet the age profile in the bottom deciles is very different from that in the top ones and that distorts any comparison.
Obviously your conclusion still stands though, those who have more should contribute more. I am not sure it is helpful to argue about a qualification point for “wealthy”, tax needs to be graduated to deal with the intermediate as well as highest wealth levels.
Noted.
Thanks.
So what are the average ages and geographical locations of each decile? I don’t know what the point of comparing the wealth of a couple living in London and working for 30 years with a household in Stoke of two 20 somethings just starting out. In fact, what is the the point of non-indexed financial data? This is an interesting snapshot in time, but it tells us nothing about where the people in these groups were yesterday, and where they will be tomorrow. 40 years ago I was in the bottom decile, today I am in the 7th. I plan to retire soon and estimate that I will probably end up dropping a decile or two. What does this prove?
Are you deliberately missing the bigger point because you are so self-obsessed?
Dear Richard,
I very much enjoyed this explanation about the wealthiest people in Britain.
If I may, I suggest that it would really concentrate the public’s minds, if you would publish a list of those wealthy people living in Britain, whose money has come solely from inheritance, and who have never had a “proper job!” These would include the aristocracy and would detail their land holdings also.
All the best,
John Starkey
That is not my role.
“Who owns Britain” is the title of a book written about 20 years ago. It’s in there.
The big owners are financial institutions. Lenders are the owners of mortgaged property for the duration of the loan. Mortgage interest is really rent.
As someone around the middle deciles, I agree with the general analysis. I know a few people who are genuinely wealthy and the decision-making process on financial matters is still quite different to mine. By the middle deciles you’re still concerned with a loss of income.
It may be worth looking at where MPs sit on the wealth and income deciles to understand why they often seem so out of touch. All of them get a well above average salary (although many London-based professionals in certain sectors earn more). They also often can claim expenses for running a second home which may help build additional wealth. There are many that are millionaires, so in terms of wealth the top deciles are over-represented and the lowest deciles barely represented at all.
Possibly a more key one is that they generally know the likely point at which they may need to find other work, have a relatively long period of job security, and are often in the same work for much longer than the average tenure in many professional roles. The middle deciles of wealth may have a fair number of representatives amongst MPs, but what many in that range fear is something like redundancy, which is a far more present risk in most roles than for MPs, so even amongst the wealth deciles that MPs may be more likely to be members of their lived experience may not be representative of those deciles. You might argue that with that relative security of station and potential for being offered lucrative side work (such as consultancy) or a ministerial position, their experience is closer to those of a somewhat higher decile.