This is new, from the House of Commons library:
This is the data that they supply:
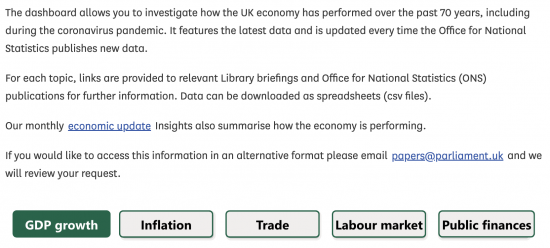
The data as it stands is pretty basic, although the fact that the House of Commons library has to create it in this way is a damning indictment of the failure of the Office for National Statistics, who seem to think that making data as hard to find as possible is their main reason for being.
I would strongly suggest that people do ask for additional information if they think that there is something that is worth securing in this way. At least the House of Commons library is open to listening, which is more than can be said of the ONS.
My thanks to David Lowry for drawing this to my attention.
Thanks for reading this post.
You can share this post on social media of your choice by clicking these icons:
There are links to this blog's glossary in the above post that explain technical terms used in it. Follow them for more explanations.
You can subscribe to this blog's daily email here.
And if you would like to support this blog you can, here:

 Buy me a coffee!

The data I’d like to see is what do tax receipts from non-doms look like following the recent changes, and what the receipts from capital gains tax look like following the rate increases. And then compare them to the predictions of economists.
That will take a long time to secure – HMRC take years to publish such information.
Furthermore, it will take a couple of years to settle down as many of those that pay these taxes will have “front loaded” things at lower rates. So, I would expect to see a sharp decline in year 1 with gradual normalisation in years 2 and 3 to a new “steady state”…. which may or may not be higher than recent years.
I would add that tax is not just about revenue it is about justice, too. If a system is deemed unfair it encourages non-compliance all round.
Agreed.