For me the most important chart in any economic forecast is that on the sectoral balances. This says who is going to save, and who is going to run a deficit. And there are only four sectors - the government, business, households and the overseas sector. The chart reflects an accounting identity - the data has to balance (as is true in reality) but where it balances is a critical indicator of the truth or otherwise of any forecast - and indicates whether it is plausible or not.
This is the OBR forecast, just published:
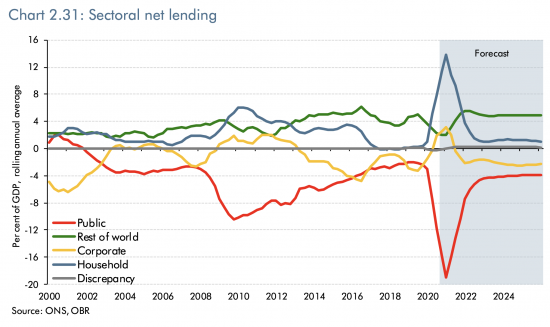
As I noted earlier today, the government deficit is matched by a massive rise in household saving this year. But it is assumed that by the end of 2022 households will hardly be saving at all.
How likely is that? Look at household behaviour after 2009 as an indication: savings remained high, and much higher than is now being forecast for 2022 onwards, until 2016. Given all the uncertainties that now exist, I suspect a 4% ratio likely, at least, for a long time to come. That is much higher than forecast, and means spending in the economy will be much lower than the OBR predicts.
Look too at the foreign sector. Will its savings in the UK grow after Brexit, as the government assumes? Why would that happen? And again, note they fell for four years after 2008 - so there is no reason for thinking that anything will be different now. I think a percentage or two could be knocked off that.
And look too at the corporate sector - where it is forecast that the sector will invest on a more consistent and at a higher level than it has for some time from 2021. But look at 2009 to 2013 and it saved during that period. As it will also do now.
In other words, all these forecasts look to be wildly overstated. And that means there must be a counterbalancing entry, and that is in the government deficit. That will not be 4% from 2022 on (which is about £90 billion a year). I think it could be 4% or more higher than that. I suspect a deficit of £200 billion a year much more likely.
This one chart says that. And all the evidence to support the suggestion is in that same chart. Economies do not bounce back from trauma in the way the OBR is assuming after massive events as happened in 2008 and 2020. It has never happened the way that the Office for Budget Responsibility is forecasting. It will not happen that way this time.
The whole forecast is floored by this one flawed chart.
Thanks for reading this post.
You can share this post on social media of your choice by clicking these icons:
There are links to this blog's glossary in the above post that explain technical terms used in it. Follow them for more explanations.
You can subscribe to this blog's daily email here.
And if you would like to support this blog you can, here:

 Buy me a coffee!

The problem is that they START from the wrong end – they assume a (desired) budget deficit number and then make up the other numbers to “add up”. Any sensible analysis (yours) would start with the other three sectors to deduce a deficit.
It’s not rocket science but just another indication of the absurd prioritization of/obsession with the deficit.
Spot on
Actually – what they say is that everything will be back to normal in X years (where X = 5, right now) and work the numbers from that
I agree. The focus is on what trajectory of the deficit the Tories think can be sustained without raising taxes on their supporters, and this requires some heroic assumptions about the behaviour of the other sectors, as Richard highlights. My additional concern is that reliance to the extent indicated (and even to the lesser extent suggested by Richard) on net lending from the RoW is never a problem….until it is.
We are now well into the East Asian century. The recent Regional Comprehensive Economic Partnership confirms this. China’s shift from brute investment and export-driven growth to consumer and high-end technology driven growth is having, and will have, a major impact on global financial flows.
Some scepticism over here (I’m in Hong Kong) about how good the RCEP will be. India pulled out because it feared being swamped by cheap Chinese imports, some tariffs will only be lifted after 20(!) years and the agreement doesn’t cover competition, state-owned enterprises or product standards. It’s forecast that South Korea and Japan will benefit the most but still will be only 1% bigger by 2030 as a result. Some members are hoping the US might join it to curb China’s influence.
@Ralph Cunningham,
I take your points. I don’t see the RCEP as a destination; I see it more as an indicator of the direction of travel. The west is in terminal decline. East Asia will fill the vacuum created.
Trump may eventually be evicted from the White House, but Trumpism is not going away. Biden will find it next to impossible to legislate for his programme of governance. The Sanderistas will continue to destroy the chances of mainstream electable Democrats. The British version of Trumpism has some time to run and Labour is ripping itself to shreds. The strategic coherence of the Paris/Berlin axis may be much better than it’s been for a long time, but even though Macron is likely to win a run-off in 2022, he will be much diminished and after Merkel we will see political pygmies who will be overwhelmed by the conflicts she has suppressed. Much of governance in the EU relies on the centre holding on against, on one side, a combination of the anti-capitalist, anti-western left, climate extremists and purveyors of identity politics and, on the other, the populist, ethno-nationalist right. That is not sustainable.
The UN is effectively defunct. Many of the flawed democracies that are populous or have economic heft (or both) – Russia, Brazil, India, Indonesia, the Phillipines, Turkey, Egypt – have increasingly authoritarian regimes. Much of world governance, such as it is, is being assigned to the G20 by default. And the G20 is being increasingly dominated by these increasingly authoritarian regimes and by actual authoritarian regimes.
The post-war settlement that created prosperity and opportunity for millions and which these so-called neo-liberals spent the last 40 years dismantling is at an end. It was a blip in the long economic history of mankind. Geopolitically and domestically we are reverting to the economic behaviour of previous centuries that culminated in the two world wars.
So, not so much OBR [Office of Budget Responsibility].
But OBI [Office of Budget Irresponsibility]
Or even OBI [Office of Budget Imagination]
🙂
Did he actually mention Brexit or forecasts of a no-deal?
No
But the OBR does
300,000 job losses
I can envisage a reduction in savings or an increase in personal borrowing all too well. The situation being that people have no money to save and need to spend what they have to stay afloat. Obviously this is not the prosperous middle class but those whose livelihood is shafted by Brexit.
But what boris needs to be concerned about is the Great Sausage Question. His supporters can’t live without Chorizo. I know all the talk is about the Wurst but only because the puns are better. However there is a Great British Tradition of smuggling and black marketing so they will be probably be ok.
You are right PSR – many will be forced to spend all they have
But there will be many insulated from all this
Tonight on C4 news, they have been comparing expenditure with two world wars – nobody seems to get however that we’d supposedly declared war on Covid-19.
To me it indicates that even now, the Government does not take Covid-19 seriously because if it did, it would treat Covid-19 as an enemy in the traditional war sense and move heaven and earth to protect the nation. It plainly has not.
I also still do not understand why they would seek to curb the wages of the sector they control when they know that the economy needs spending to prop it up!! The economy needs disposable income!! And this budget denies it in the face of the cuts the private sector has made and which the Government has offered half-hearted help as well.
I think that this lack of commitment to spending indicates what this administration has always about since 2010 – slash and burn. It is not in their nature to tackle Covid and its complex consequences at all.
To sum up, Johnson and Sunak & Co are simply incapable of dealing with it. And I also sense that this budget is also treating Covid as it is already conquered, and that the Tories will take away support too quickly despite telling us to be careful!
BTW – the IFS’ Paul Johnson was on C4 news tonight too.
I’ve never ever seen anyone fart from their mouth before. Incredible!!
🙂
[…] There is more on this here. […]
Am I correct in thinking that the OBR was set up by George Osborne to normalise neoliberalism (as the only “responsible” economic viewpoint ) into the state apparatus? Does it have any useful function?
You are broadly right
It was meant to be independent but frankly it is now just a Treasury forecasting team