Thanks for reading this post.
You can share this post on social media of your choice by clicking these icons:
There are links to this blog's glossary in the above post that explain technical terms used in it. Follow them for more explanations.
You can subscribe to this blog's daily email here.
And if you would like to support this blog you can, here:

 Buy me a coffee!

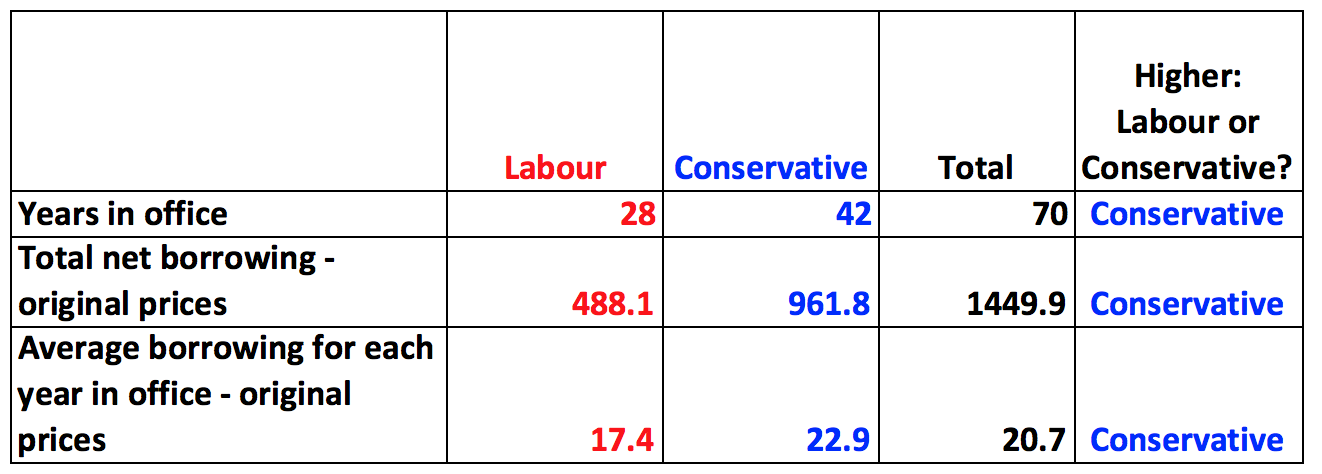
I had gathered this was the case but it’s good to see it paid out so clearly. Is there a summary that shows how much the economy has grown during each parties time in office?
Sorry: I have not done that
The loan data from the House of Commons Library does not include the 1946 loan from USA/Canada (about $5 billion – rather significant when Government deficit/surpluses were in the region of +/- £100 million).
Did you check whether the 1976 IMF loan was included in the statistics – does not appear to be an increase in borrowing expected in 1976, so it would appear that it was not.
Links?