The government has issued new statistics today on the taxable income and tax paid of people in the UK split into single percentage point bands.
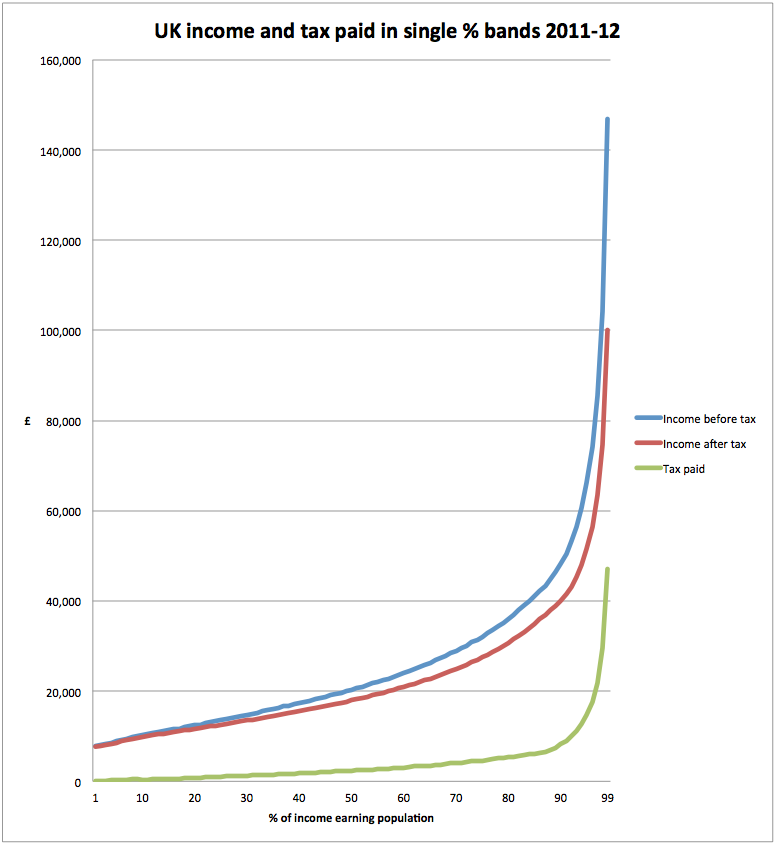
I have plotted the data for 2011-12 tax year (the most recent available) showing total income before tax, income after tax and by deduction tax paid:
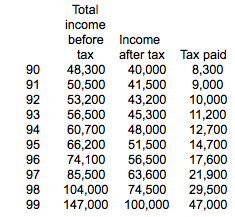
To make clear how steep that gradient is for the top 10% this is the data for this decile:
So let's be clear what this shows.
The first thing is that just 1% of people might be subject to the 50% tax rate.
The reason why they are subject to this rate is that their income and therefore their capacity to pay a higher rate of tax is completely different from that of the rest of the Uk community - even when compared to those in the next percentage point below them.
And these people are not in the 'middle class' of incomes. Those who argue that they are are living in a totally different world to the rest of us. And that is why they need to, and should, pay a lot more tax than everyone else especially when 50% have pre tax incomes of £20,000 or less.
Thanks for reading this post.
You can share this post on social media of your choice by clicking these icons:
You can subscribe to this blog's daily email here.
And if you would like to support this blog you can, here:


SO don’t earn more, therefore you don’t pay tax.
Who would have thought, what a brilliant idea.
More than could be said for the comment.
I get it.
So they get less salary, their tax rate reduces and the money the country gets goes down.
What this thread tells us, people on the top rate tax, do pay top rate tax.
Actually…no it doesn’t
The data ignores what they hide
And they can hide
Most can’t
Paul
I think that comment perfectly illuminates the truth of Alexander Pope’s “a little knowledge is a dangerous thing”. You haven’t understood this at all, have you?
Is this income before and after income tax or all tax?
Income tax
Luke’s idea has one main benefit.
If the top 1% ‘earned’ less, then that leaves more wealth for the rest of us (it is all the State’s money, ultimately, after all), so the rest of us get richer, the top 1% will become poorer. Good.
But the downside to Luke’s idea is this: if the 1% earned less, that means they pay less tax. That is not good.
We need to design the tax system in such a way that the 1% actually pay more tax for earning less. If we can achieve this (maybe through a crackdown on avoidance through a GAAR), this will give Society 2 benefits from the rich earning less: 1) we get them to pay more tax and 2) the poor get richer, they rich get poorer, as described above.
What’s not to like?
You forget that income Dax is not the only tax
Redistributing wealth leads to mire spending and less saving and that creates more work, more tax, less benefit, higher VAT, more duty, etc, etc
The relationship is not a single shift, it is cyclical
So those on £147,000 pay around 32 percent tax on their income, not a whole 50 percent as some would have us believe.
It is the amount they pay between the tax bands they pay, is it not? And not half the entire £147,000?
Errm – the higher rates (eg 50%) apply above their banding (eg 150,000) below is at the lower rates. Sigh.
“Errm — the higher rates (eg 50%) apply above their banding (eg 150,000) below is at the lower rates. Sigh.”
Yes, well done Max. I was referring mostly to the misleading impression many try to give that a 50 percent tax rate means a 50 percent take of wages. In most (if not all) it doesn’t!
All income tax is on a band basis, you pay increasing rates of tax on each successive band of income. Otherwise it would make no sense at all to accept a pay rise that put your income just into higher rate tax, since you would promptly double your tax bill from 20% to 40% and be significantly worse off.
Income inequality has grown significantly, with the result that the percentage of the overall tax take paid by the top band, however you break it down, has also gone up significantly. However, what these and all other figures like them never show is the effect of national insurance contributions, which now raise about two thirds of the amount that income tax does. Depending on how you treated employer contributions, these would probably move the distribution somewhat more towards equality – the true marginal rates of tax+NIC for employees are 12%, 32%, 42%, 52%, ignoring benefit and allowance withdrawals.
To be precise, the marginal rate, excluding NI, is 60% between 100 and 120 (for next year at least, as for this year it was only between 100k and 118800), and then falls back to 40% until 150k…
Reading a much earlier post on a similar issue drove me to seek out the ONS data set, so for those who are seriously interested in this topic, look at table 14 released on 10 July 2013 at the ref below.
Not only does it support the figure that the top 10% of households with the highest incomes received 27.0% of the total gross income, but more importantly (to me) it shows that the top 10% received a staggering 31% of the total original income (i.e. wages and salaries + benefits in kind + self-employment income + private pensions & annuities + investment income + other income). Of course, the same data set also shows that the top 10% actually pay 27.5% of all tax (direct & indirect) on their total gross income. Note it’s ONS data, not the HMRC which Richard is commenting on.
However, the issue is not just tax, it’s disposable income. So, with a disposable income of £ 75,527 pa it’s hardly surprising that the top 10% are able to do a lot more to perpetuate and improve their economic advantage compared to the bottom 10% with their £ 9,028 pa of disposable income
http://www.ons.gov.uk/ons/datasets-and-tables/index.html?pageSize=50&sortBy=none&sortDirection=none&newquery=income+tax+decile
Thanks
I shouldn´t worry about it too much:
http://www.golemxiv.co.uk/2014/01/on-death-and-derivatives/
Very soon there are going to be other problems……..
I had read this
Worrying
How about this then:
http://www.testosteronepit.com/home/2014/1/31/no-wonder-german-workers-drag-down-retail-sales-and-much-of.html
As we head in their direction…………………living the dream!
very sad for these people and their families – maybe the first signs of the derivatives unwinding? These financial instruments have taken on a Frankenstein aspect over the last 30 years.
http://www.zerohedge.com/news/2014-02-01/market-cornered-jpmorgan-owns-over-60-notional-all-gold-derivatives
OOppss….
Every now and then ZH has a habit of printing things that make me think (painful!):
¨This brings us to the second undesirable and unjustified source of income inequalities, i.e., the creation of money out of thin air, or legal counterfeiting, by central banks. It should be no surprise the growing gap in income inequalities has coincided with the adoption of fiat currencies worldwide. Every dollar the central bank creates benefits the early recipients of the money–the government and the banking sector – at the expense of the late recipients of the money, the wage earners, and the poor. Since the creation of a fiat currency system in 1971, the dollar has lost 82 percent of its value while the banking sector has gone from 4 percent of GDP to well over 10 percent today¨
http://www.zerohedge.com/news/2014-02-01/how-central-banks-cause-income-inequality
Trickle down theory is still dominant as NEF observe:
“Worst of all, the powerful have clung to trickle down for so long that people are starting to confuse it with common sense.”
To concepts that need to go:
1. The Housing ‘ladder'(no rungs left).
2. Trickle down theory.
I thought this might be a good place to put this Beatles’ classic from Revolver. It’s called Taxman and is George Harrison’s rather whingy riposte to what admittedly pretty high taxes, back when the rich REALLY paid high taxes in Britain. The “There’s one for you, nineteen for me” refers to there being 20 shillings to the pound and, apparently, 19 shillings went to the taxman.
Enjoy! 🙂
http://youtu.be/ZqK97av7I3s