One of the issues that is becoming very apparent in recent weeks and months is how hungry people coming here are for data and reliable opinion upon the economy.
I stress, I do not think I am the sole repository of this: one of the great things about this blog now is the number of well-informed comments it attracts that makes it, unlike almost every other blog I know, worth reading below the line.
To assist this process, and to assist my own research I have decided to start pulling together my own research and to assemble it on the Tax Research Wiki.
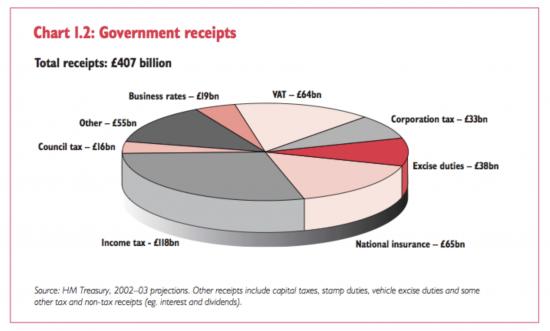
I am making a first contribution this morning. I have for many years been collecting the data that has been published by the Treasury each year in budget publications that summarises forecast income and expenditure in pie chart form. They have been doing this since the turn of the century but finding that information is now pretty hard. So I have decided to publish the data.
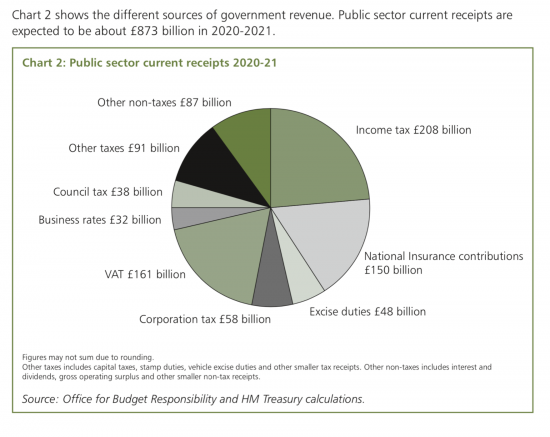
Budget forecasts do not, of course, indicate outcomes. The forecasts for 2008 / 09 and (no doubt) 2020 / 21 are proof of that. Nonetheless, the data is useful as a way of seeing how government priorities have changed over the years.
Further documentation will be produced to indicate what they might suggest as to those changing priorities and will be published in due course.
And I stress, for those who want summaries in Excel and chart formats, they will be coming soon.
This is an indication of what is on offer, This is the pie chart of total income for 2003/04:
And this is the same data for 2020/21 (which will not turn out as forecast):
All this data will be brought together on the wiki as it is published.
Thanks for reading this post.
You can share this post on social media of your choice by clicking these icons:
You can subscribe to this blog's daily email here.
And if you would like to support this blog you can, here:


Hello Richard
I am no expert in this field, being a retired agricultural engineer. Perhaps that is what encourages me to try to see things in simple terms. Looking at these figures, and getting to work with a calculator I have concluded that from 2003/04 to 2020/21, the tendency has been for a reduction of contributions of 7.64% from corporation tax, income tax and business rates. These being sums mainly paid by the rich.
Whereas there have been increased contributions of 4.32%, from VAT, National Insurance and Council Tax. These being sums that are mainly by the average and poor.
Does this not show in stark terms that it has been deliberate government policy to transfer resources from the poor to the rich, as we have always known.
As I say, I am no expert, and this was only a very quick look at these figures, but hopefully could be helpful.
I will be publishing data based on these figures over the next week or two
I have been tearing the data to pieces