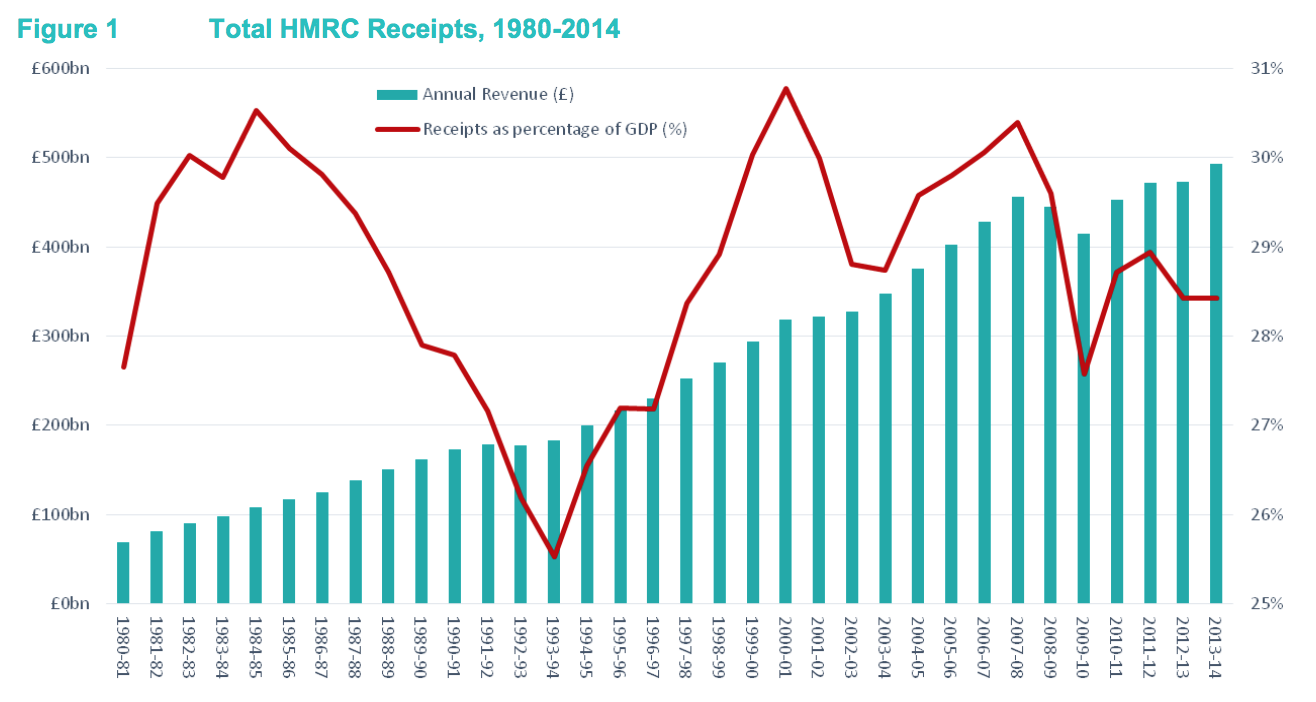
This chart was issued by HMRC this morning:
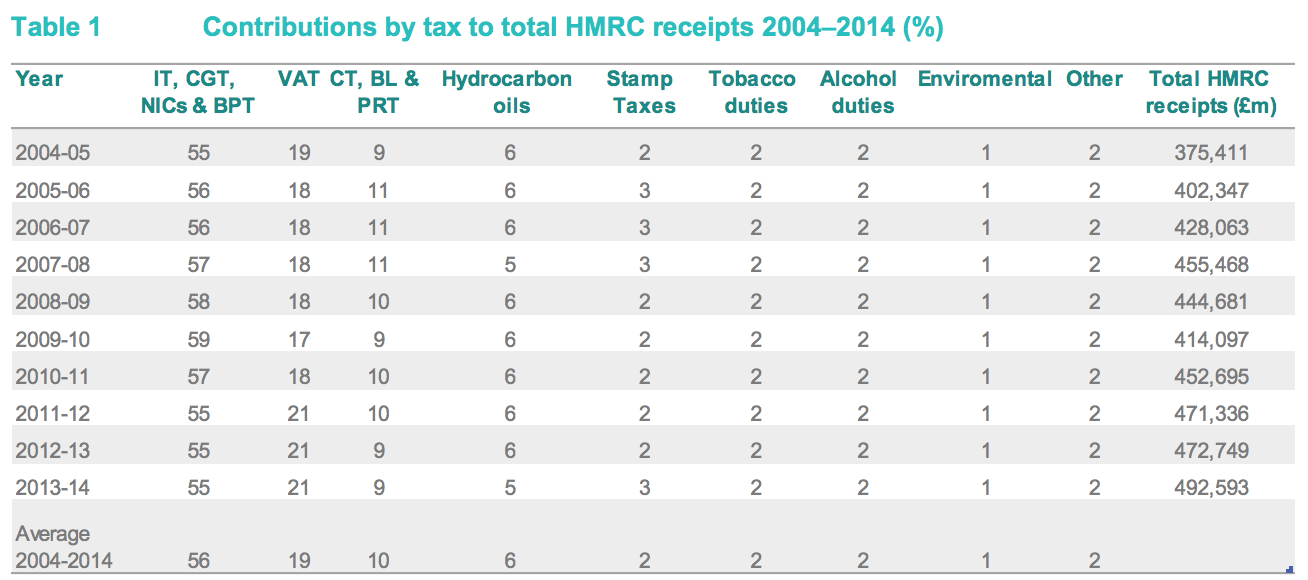
As was this table (which I would have preferred over a long time period but have not had time to create, as yet):
What's their significance?
First, we are not being overtaxed at present. In fact, it is fairly obvious that the economy's capacity to pay tax is not being exploited, despite the deficit.
Second, the benefit of that is not being evenly spread. As the comparison of the 2013-14 data with the average data for 2004-2014 shows, income tax yields have fallen (and that is almost entirely at the top rates), as have corporation tax yields, whilst VAT is risen.
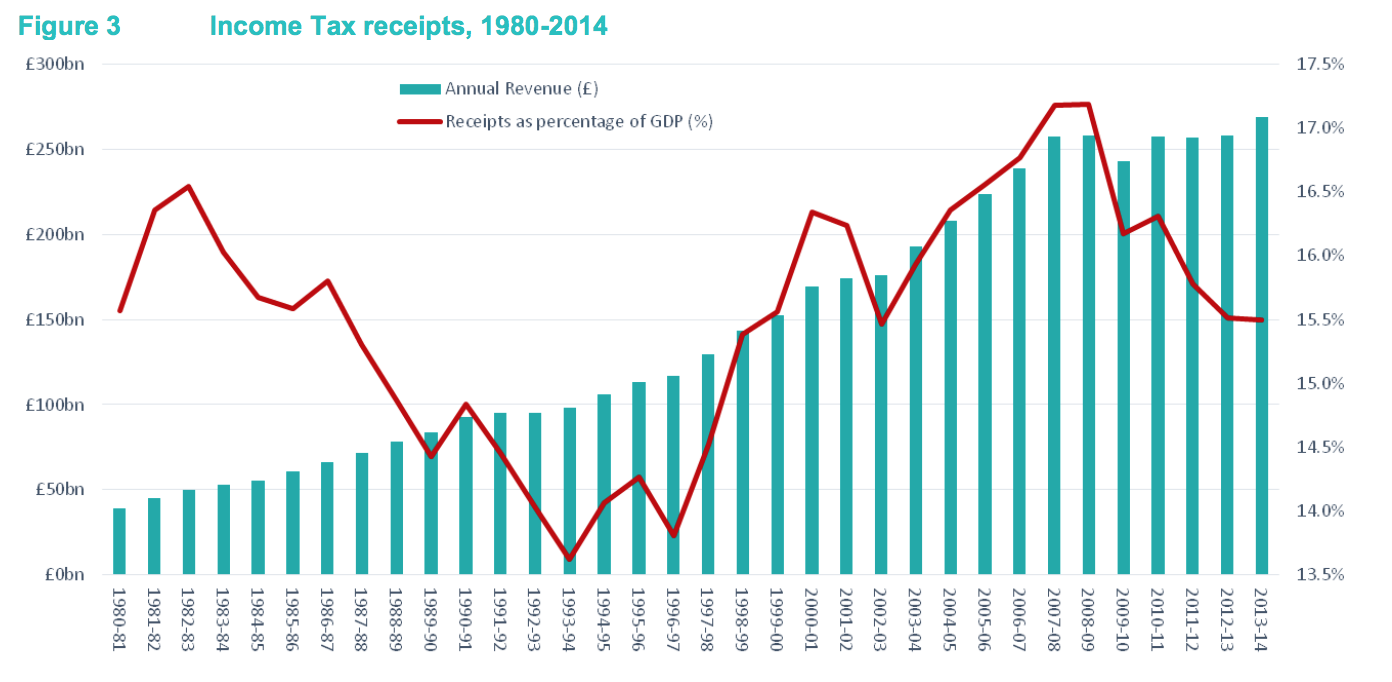
The conclusion is obvious: those who already suffer the highest overall rates of tax in the UK (who are not the top 10% of taxpayers) will have seen their tax burden increase under this government whilst those at the top are seeing them fall, which fall is creating a shortfall in government income which is then being used as an excuse for further austerity, which is harming those least well off in our society.
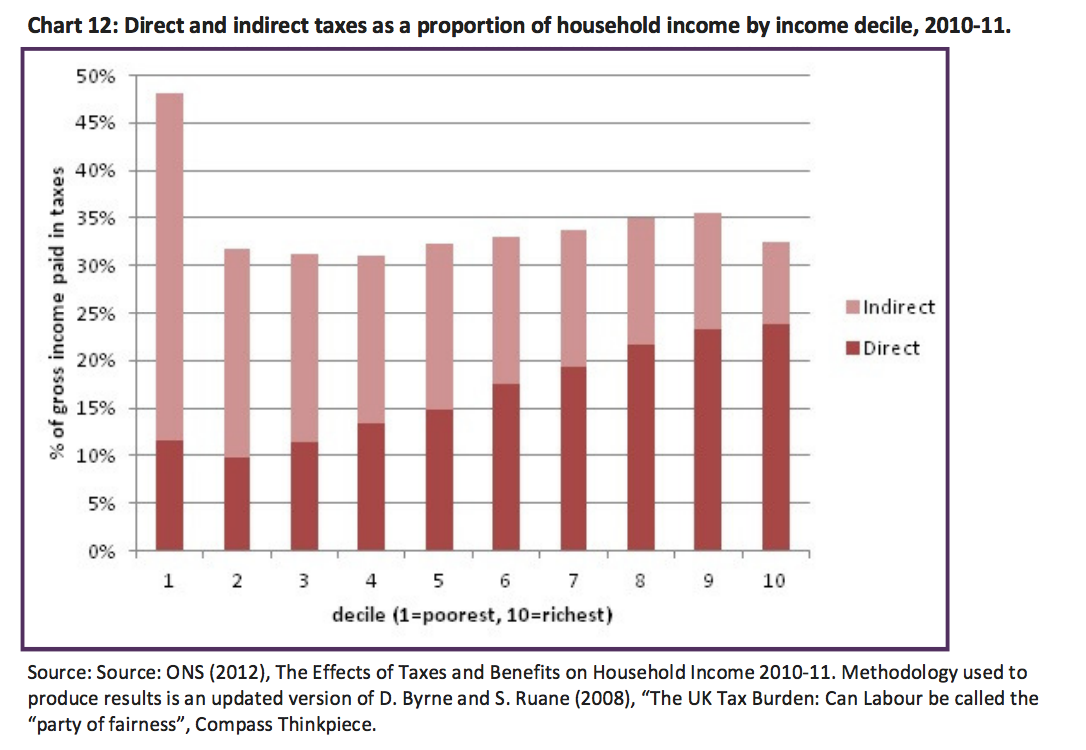
And for those who think that the best off in the UK pay the most in tax as a proportion of their income, think again:
The tax system we have is unjust, and that is an increasingly obvious trend, as this table on income tax receipts makes obvious:
Some are having a good time. Most are not.
Thanks for reading this post.
You can share this post on social media of your choice by clicking these icons:
You can subscribe to this blog's daily email here.
And if you would like to support this blog you can, here:


I expect someone will point out that people at the lower end will usually be net recipients due to the benefits system. I think that is a relevant fact, but I am very well aware that people further up the chain do also benefit, significantly, from the spending of taxpayer money – both in cash terms (benefits and employment in the public sector) and indirectly (as many of those who earn their wages in the private sector, work for companies with significant government business). So when I say that I think the net position is relevant, because it shows the steps that we take to use the money collected to help those who are worse off, then I hope it’s seen as something said without ignorance of the overall picture.
But my reason for commenting was not that. It’s that we know that people with higher incomes pay proportionally less in direct taxes because they spend their money on things where no such taxes are levied. Outside of the top few %, that’s invariably their home. That’s why LVT is inherently fairer than most of our existing taxes (especially truly regressive ones like VAT and other duties which are levied at high rates on essentials like food, clothing and fuel). That’s why it saddens me that so few people seem to see LVT as a possibility for a dramatic shift in the tax base (as oppose to the modest contribution that ‘mansion tax’ initiatives propose).
I know you believe that an element of LVT might be a good idea, but if you really want to change the shape of that chart (and I do) then doesn’t it need something much much bigger? An LVT that simply supplements the existing tax base can only go so far. That chart of the proportion of GDP going to tax makes it look as if there’s plenty of scope to go back up (if one were minded to), but the scale is misleading in that regard as we’re only 1.5% below a recognisable high point (£25bn? extra, or is my maths failing me?). If you want to really change things you have to change what we currently tax to something else that’s a better representation of wealth than the ability to feed a family and put fuel in the car.
You seem to agree that income taxes are already high enough for most people. Higher corporation taxes could fund lower indirect taxes – but giving the benefit of that to the poorest would be impossible – as they are all still shopping for the same goods as most of the rest of us. They don’t, however, own the property that those who are better off do – so LVT really does leave them alone and only target those who are unambiguously rich enough to own the land they occupy.
For all that the ‘tax justice’ movement has achieved, I don’t see anything that it’s doing that would change that bar chart the way that it needs to be changed, because it’s so bound to the idea of fixing the current system.. instead of casting the current system aside and building a better one.
I am writing on LVT for new book this morning…
Richard
Out of interest (this is a genuine question and not one to get you to answer so that I can then attempt to troll you).
What would you consider to be a fair level of VAT? And how could/does this rate interact with say income tax etc.
Thanks in anticipation.
Right now I would seek to cut VAT
What is a fair rate? 15%?
I would also consider progressive rates on different goods – and take the risk of dispute on what a Jaffa cake is
Excellent, stop tinkering around with the current system and instigate something new. Well new to the UK anyway.
And the beauty of it is that it’s totally unavoidable/evadable – even for oligarchs and non doms. However, I support the ‘Mansion Tax’ as an interim measure since it will take a year or so to implement LVT. As a campaigner I have previously emphasised the inroads which could be made into income tax for ordinary workers, however, a cut in VAT would be far more effective now in giving the economy a boost.
Why do the lowest decile pay such a large proportion of their gross income in indirect taxes, compared to the next couple of deciles? What is the mean (or perhaps better median) income in each decile?
Surely not it is not VAT on food, as much of that is zero-rated if you pick carefully. Domestic gas and electricity bear 5% VAT. What else is it?
No doubt the top decile pay the most VAT in absolute terms, even if they also spend a lot of their income on investments in assets (such as stocks and shares, and land) that does not bear VAT.
For me, it is remarkable how little the contributions to total receipts change from year to year. IT, NICs and CGT and BPT drifted up a few percentage points to 2009-10, and then down again; VAT was consistently about 18% of revenues when the rate was 17.5%, dipped a bit when the rate fell to 15% temporarily in 2009, and then consistently about 21% after the rate went up to 20% in 2011; and CT has bumped around from 9% to 11%, with little correlation to the reduction in rates from 30% in 2007 to 21% in FY2014.
Council tax
Duties
VAT
They make it up
Everyone agrees on that
Nearly 40% of the lowest decile’s income is paid in council tax, duties (presumably fuel, alcohol, and tobacco) and VAT? How much in each category?
And the lowest decile are paying a larger proportion of direct taxes than the next decile? How does that work?
If everyone agrees, can you suggest some sources with more data and explanation? (I’ll follow up on john77’s suggestion below, but where do you get your information?)
ONS
Household income survey as I recall – bit all specced in the link
Stnadard statistical source
Andrew,
The so-called bottom decile includes students living in flats but not halls of residence (so including nearly all those with rich parents, with no income recognised by thge Household Survey as neither parental subsidy nor student loans are recognised) and self-employed people making a loss. Hence the Household Income Survey shows that VAT was 14% of the decile’s gross income or 16% of disposable ioncome, tobacco and alcohol duties were 5% or 6%, *Employer’s* National Insurance Contributions were 4%, business rates 2%, other indirect taxes 11% or 13%. A simple piece of arithmetic shows that the net of VAT amount spent on VAT-able goods (so excluding food, books, public transport and children’s clothes) was 127% of the decile’s after-tax income.
They did spend something on food.
You may draw your own conclusions about the utility of comparing expenditures with the aggregate income, comprising the sum of some positives, some negatives and some zeroes as a measure.
All statistics have outliers
Claiming they are the population is absurd, or desperate, or both
Dear Mr Murphy,
I am not pretending any of the outliers are representative ofthe population.
I am merely explaining an anomaly and pointing out one of several reasons why one element of the Household Survey may give a misleading picture.
After all, it is your graph not mine.
It’s ONS data
I don’t mind paying more than the average; I earn more than the average. I do mind that people earning more pay less.
I mind, and rather more than ‘mind’, that a great many things I used to get for free in my taxes must now be paid for; and, worse, that these services were sold (or given away, with decidedly dubious motives) as a ‘rent’ over me. As are many of the things that I do still get for my taxes, at a much-reduced quality of service; and all of it at a profit to people who appear to pay no tax at all.
You are part of the solution to that, in the long term.
Here and now, if I enjoyed the public services they get in Sweden, I’d pay the taxes that are imposed in Sweden.
I like the idea of Social Security and an effective state, and I’m willing to pay for it.
But that’s not what I’m getting, here and now, and there’s a question here: what’s the worth of an imperfect social compact? And what’s a fair payment for a badly degraded one?
I do not see why I shouldn’t keep 50p in every extra pound I earn; add up NI and VAT and charges for Local services – and lets forget about nondiscretionary payments for services that used to be funded by taxes – and keeping half of what I earn is rather difficult.
Here and now, I’m not getting what I’m paying for, and this is getting worse. So, too, is the galling inequality of obligation, whereby the even-better-paid pay less, and the profiteering parasites at the very top pay nothing. So, too, is the risk that we’ll see a rerun of 1978, where the middle classes were squeezed in a panic-stricken struggle to ‘balance’ a deficit that was largely caused by a collapse in tax compliance among large companies and the wealthy.
The moral case for taxes has been degraded, and the economic case for avoidance or evasion has become increasingly compelling.
Going by this: http://www.theregister.co.uk/2015/02/20/uks_tax_website_is_a_nightmare_but_it_could_have_been_even_worse/
Things are going to get a whole lot worse, before they get a little bit better!
While I agree that the economy’s ability to pay tax is not being *fully* exploited I must point out that your own chart is not a measure of the present government’s policy but is, as your reference states, an adjustment of 2010-11 data using methodology invented to argue whether the last Labour government was fair.
ONS data shows that a markedly different picture for 2012/3 and when data for 2014/5 is published the difference will be greater still. The tax take for the bottom decile had fallen by 10% of gross income while that for the top decile had increased by 3% of their gross income. The benefits received by the bottom quintile were more than three times the total of direct and indirect taxes (of which the largest share must have been tobacco and alcohol duties since the highest rate of VAT was 20%, with food and children’s clothes and public transport being zero-rated,and indirect taxes equated to over 30% of income after direct tax). Excluding tobacco and alcohol duties, taxation (even excluding benefits) was progressive by 2012/3. http://www.ons.gov.uk/ons/dcp171778_367431.pdf
You may note that tax paid by the top quintile doubled the income of the bottom 40%, reducing the ratio (top quintile vs bottom quintile) from 5.8x for original income to a more reasonable 2.0 for final income.
I have not a clue what you are trying to say
The data is from HMRC
And of course if you exclude selected taxes you can come up with the answer you want
Respectfully: you seem to be making this up
Just look at my reference, which is ONS.
*I* am not making anything up.
I quoted actual data and then commented on the impact of the regressive tobacco and alcohol duties.
And made up a conclusion by excluding relevant data
Thanks, john77. The diagrams on page 4 (showing household income, before and after the effect of tax and benefits) and page 6 (showing the elements that create the net effect) are fascinating, and there is more data in the tables on pages 8 to 11.
The net effect is that:
* the household income of the bottom 20% is nearly trebled, from about £5k about £15k;
* the household income of the next 20% is nearly doubled, from about £10k to about £20k; and
* the household income of the top 20% falls from about £80k to about £60k.
No need to make up a conclusion.
Tzx works to redistribute
That is one of its primary purposes
Thank heaven for that
Whilst you can’t just exclude certain taxes to paint a different picture, if certain taxes have a dramatic effect on the picture you have then it’s fair to question their role, surely?
‘Sin taxes’ on tobacco and alcohol have risen faster than most (if not all) others, and in the case of tobacco are at truly punitive levels. If you agree that these taxes are high for a good reason, a position you’re entitled to hold, then you have to accept that you are in agreement with a large constituent of that regressive picture.
Personally I disagree with the high taxes and I think that one of the reasons they are so high is that they are known to disproportionally impact poorer people, and so politicians and other taxpayers don’t really care that they are unfair.
I think that’s an interesting point in that it suggets benefits must allow for this as they do, for example, in Scandinavia
Interestingly, I downloaded the OBR public finances databank (to use for a project on public spending I’m currently doing for the TUC) and their figure for “public sector current receipts” for 2013-14 is £622.3bn compared with total HMRC receipts of £492.6bn over the same period. So the govt is getting approx £130bn of revenue from sources other than HMRC. The OBR glossary indicates that public sector current receipts comprises “Revenue relating to activities in the current year, comprising mainly direct and indirect taxes, but also including social security contributions, interest, dividends, capital taxes and profits from trading activities”. At some point I’ll try and dig out a breakdown of the other £130 bn which isn’t tax receipts.
Council tax and business rates are a big part of it.
So too was interest on £375bn of QE.
The OBR tax figure is much higher – something like £560bn
I promise not to argue we are “ovetaxed” as you ask but will say we are overtaxed. Perhaps it would be wise to check your spelling first.
I write well over half a million words a year
Sometimes an error creeps in
So what?