I have already mentioned the political furore slowly developing over HMRC's bogus claims of compliance tax yield this morning, but I also think it important to point out that the claim that this is increasing also has inherent problems within it.
My evidence is from HMRC's 2013/14 annual report. The first claim I want to refer to is this:
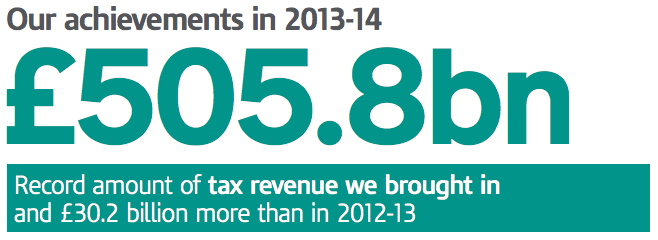
So that's £505.8 billion of revenue in 2013/14 and £475.6 in 2012/13.
Then there's this on compliance yield:
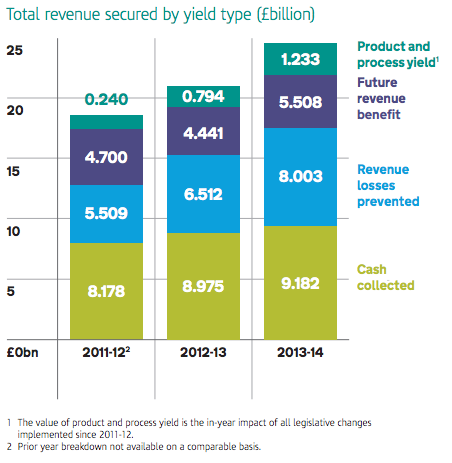
As I've already noted, only cash counts, so that the relevant figures are £9.182 billion in 2013/14 and £8.975 billion in 2012/13.
The first thing to note is that CPI to March 2014 was 1.6% but on a heavily downward trend: during most of the year it had been over 2% and in September 2013, a fair mid year measure for comparison purposes, had been 2.7%. What that means is that in real terms the 2013/14 yield recovery was in real terms lower than in 2012/13.
And that's also true in another way. The percentage yield recovery in 2012/13 was 1.89%. In 2013/14 it was 1.82%. The recovery rate was worse.
HMRC have a weird idea of trumpeting success that is no such thing. It may be better off actually investing more in getting the job done by employing a lot more staff to close the tax gap.
NB: My new report on the UK tax gap is out on 23 September.
Thanks for reading this post.
You can share this post on social media of your choice by clicking these icons:
You can subscribe to this blog's daily email here.
And if you would like to support this blog you can, here:


what is `future revenue benefit`?
Made up numbers of what might have happened
Why is the CPI for the 12 months to September 2013 of any relevance? Surely 1.6% is the rate to use?
It was for a year, not a year end so a mid point makes complete sense
It is called averaging over a period
CPI is already averaged over the period. That’s the point of it. It measures the difference between the beginning and the end of the period.
Using a mid point only makes sense if you don’t understand CPI, or if that’s what gets you the answer you want and you’re banking on nobody noticing (or that if anybody does notice you can just delete their comments or call them ‘neo-liberal apologists for avoidance).
So which is it?
So it measures March 2013 to March 2014
Which entirely ignores 2012/13 – which is in the basis I am comparing and which you would as a result completely ignore, incorrectly
Sorry – but I just think you’re wrong
And even 1.6% would embarrass the HMRC claim
I think you are misunderstanding how CPI is measured. The September 2013 figure tells you the change in the CPI from September 2012 to September 2013. That’s irrelevant for your purpose. What you want is the change in CPI from March 2013 to March 2014, and that’s the 1.6% figure.
I disagree
I am looking for an average change from 2012/13 to 2013/14
Not for March 2013 to March 2014
Therefore a mid point is fine
I think what the others above are trying to point out is that averaging year on year CPI numbers is mathematically incorrect, and for your purposes pointless and unnecessary.
For your calculation you only need the March YoY CPI number to get an exact number for the preceeding 12 months CPI increase, with reference to the preceeding 12 months. I’m not sure why you have “averaged” anything when you can directly compare like with like for the two years.
What you are doing is averaging a stochastic variable – which is meaningless. I am guessing you no real training or experience in CPI modelling or the maths behind it – this is pretty much the first thing they teach you in economics courses or finance when dealing with CPI.
I would also take serious issue with the calculation you have done to give you a “percentage yield recovery”. Your denominator is not directly comparable – not least thanks to economic growth and ever changing tax laws, amongst other things. You attempt to normalise for CPI yet do not do the same for GDP growth, for example.
You are basically saying there are only two variables – tax recovery and total tax reciepts, and that they are dependent variables. In reality, they are not dependent variables. Total tax reciepts will be GDP dependent, whilst the recovery term will not be dependent on GDP.
You would have done better to simply compare the two years of yield recovery and normalised for CPI and GDP growth – that would give you a more sensible first look estimate. My back of the envelope calculation for that suggests HMRC have actually increased their cash recovery by about 1%. As I say though, one would then have to factor in various other effects.
I get the impression you have a limited understanding of such calculations though, and instead have resorted to torturing the data to prove a point – such as the need to hire more HMRC staff – by your PCS paymasters.
Well I admit I have not gone into the detail of CPI calculation for years, so if I’m really wrong, so be it. Such things can happen, although I happen to think your logic is still wrong: settlements take place right across a year, so the CPI at the start of the year would not be 1.6%, but a figure much higher, and you are ignoring that fact, I think.
But even if wrong, and I deflate the second year for GDP growth and inflation (as would be necessary) the recovery is worse.
Indeed, it is only break even on 1.6% – and given the randomness of monthly variations in this data (which is another reason for taking a higher, more realistic figure for the year as a whole) that is freak which any other month end would not have delivered (hence my questioning the relevance of your claim).
However you look at it I don’t think you can claim an increase when the most basic CPI adjustment would knock it out.
So we differ
Unless you can show detailed working of all variations showing I am wrong.
PS And what is the PCS paymaster thing about? I’ve never once received instruction from PCS. I have supplied them but does that mean if I also made a sale to, say, Sainsbury’s they’d then be my paymaster? Perhaps you’d like to explain that too
OK here goes.
Firstly let us just look at the increase in cash collected. Divide the 2014 number by the 2013 number and you get a 2.3% increase.
This does not tell us much in isolation.
So let us normalise this. GDP grew by 3.0% to the end of March 2014. March CPI YoY (so covering the same annual period) was 1.6%. Now take the 2013 cash collected and inflate by GDP growth, and *deflate* by CPI to get the real (CPI adjusted) expected value for the 2014 number. In this case it is 9.099bn. Compare to the actual 2014 number and you get an outperformance of approx 1%.
This is a dirty calculation. To get a more accurate number you should really go back to the underlying indexes for both GDP and CPI.
Using the total tax reciepts as a denominator, as you have done, makes the calculations meaningless as you are simply not comparing like for like. Too many variables affect the denominator, so where you can yoou should try to always compare like for like and reject inserting new uncertainties.
Likewise, as you say tax collections don’t all happen at the same time, so to get a better estimate you should take monthly collections and then treat them as a series of cashflows to get a better answer. In real terms though it won’t make a huge difference.
You do seem to only argue for more staff at HMRC, by arguing that collection rates are falling. This is pretty much the PCS line, and they pay you. The data shows other though. What am I to think?
So, what you’re saying it’s all approximation but you think mine wrong
Trouble is, you have definitely not offered anything better
You’ve just pretended there are more variables
And yes I argue for more staff at HMRC – but then so too does almost everyone in the tax profession. Are they all in PCS’s control and pay?
To add:
You should really normalise by the ratio of tax reciepts/GDP as well. Don’t have time for that at the moment am afraid.
RPI/CPI who cares? What matters is that only £9 billion of the £24 billion claimed for 2014-15 is real.
Yes
Wood and trees and all that….
“So, what you’re saying it’s all approximation but you think mine wrong”
No, I don’t think your working is wrong. It is wrong. In mathematical terms it is nonsensical. You can’t average CPI like you have done so and you can’t use total tax reciepts as a denominator.
“Trouble is, you have definitely not offered anything better”
Really? I’ve shown you the basic version of how the calculation should be done properly. As I say, the true answer will involve a much more detailed analysis but the basic methodolgy I use is sound. Your methodology is not.
“You’ve just pretended there are more variables”
There are more variables. Especially if you are trying to compare it to total tax reciepts – which you will notice my method doesn’t do.
As far as I can see, you don’t have a clue what you are doing and have just made stuff up to get to the answer you were looking for in the first place. Looking through your blog it does seem that every time anyone points out that you are wrong you just claim you are right, without proof. Maybe you should actually go and spend some time and learn some basic financial mathematics before putting out these puff pieces of yours – at least that way people won’t be able to tear you apart for simply getting the numbers wrong. Again.
Respectfully, I noted what you said before and responded, I think appropriately
Reiteration does not change my response, including the fact that I think I can mist certainly do the proportionate calculations it did with our making any apology for doing so
I also still think you miss my point in CPI, but can’t be bothered to reiterate why
You responded by claiming your calculation is correct and dismissing mine, without explaining why. Yes, my calculation is an approximation, but at least it has been approached from a sound basis.
Your method is fundamentally incorrect. You have abused CPI and used total tax reciepts as a denominator without adjusting for tax reciepts as a percentage of GDP for a start. Also, by introducing the total tax reciept number you have introduced uncertainty as various factors affect this number (not least changes in tax law) which do not necessarily have a correlation with the cash collections number. You certianly haven’t explored what has gone into the variable you have chosen to use as a denominator.
It’s poor economics and painfully inadequate maths, and the best you can do is simply claim you are correct and I am wrong because it is an approximation. My approximation is more sound than your nonsense I’m afraid.
I think you are now resorting to the type of “mine is bigger than yours” argument that I hoped most people left behind a long time before they got to commenting here
That is exactly what you did to me!
I have set out my workings as asked, and set out why yours are incorrect.
You will notice the middle paragraph of my last post spells out pretty much what you have got wrong, as do my other posts.
When presented with this you have gone directly to the mine is bigger than yours argument you are accusing me of.
Is there something here I haven’t understood? “Revenue losses prevented” means what, exactly? Surely the common sense meaning of this phrase is “cash we got in, which was at risk of not being received.” If that’s the case, then the revenue losses prevented must be included in cash received, and the revenue losses prevented represent double counting.
Or have I misunderstood?
Revenue loss prevented is a guess of what might have happened in the future
It’s equivalent to the income I might get next year if I complete this year’s contract acceptably
The first thing about that it is a complete guess
The second is it cannot be claimed now
“The first thing about that it is a complete guess
The second is it cannot be claimed now ”
Unless you take the Enron approach to accounting
Richard,
In the optimistic hope that after the end of September we will be heading for an independent Scotland. Can you guide me to any of you writings that lay out a suitable Tax system for a new country which will effectively address the problem of inequality without doing serious damage to the general prosperity of the vast bulk of the inhabitants
The Courageous State
But, to be honest, The Joy of Tax
I’m writing that right now
You’ve got this wrong, Richard.
I have acknowledged the possibility
Equally I think you place too much credibility apron any month’s data
I also think you ignore the more telling proportionate aspect