The Office for National Statistics has been claiming that their recent work on household incomes shows that:
There was a fall in income inequality between 2010/11 and 2011/12.
However, as they also say:
This was driven partly by earnings falling for higher income households and partly by changes in taxes and benefits. These changes include an increase in the income tax personal allowance and changes to National Insurance Contributions and Child Tax Credits
Well, this is partly true. But there's another issue which is this. Look at the distribution of income by quintile (that is 20% banding):
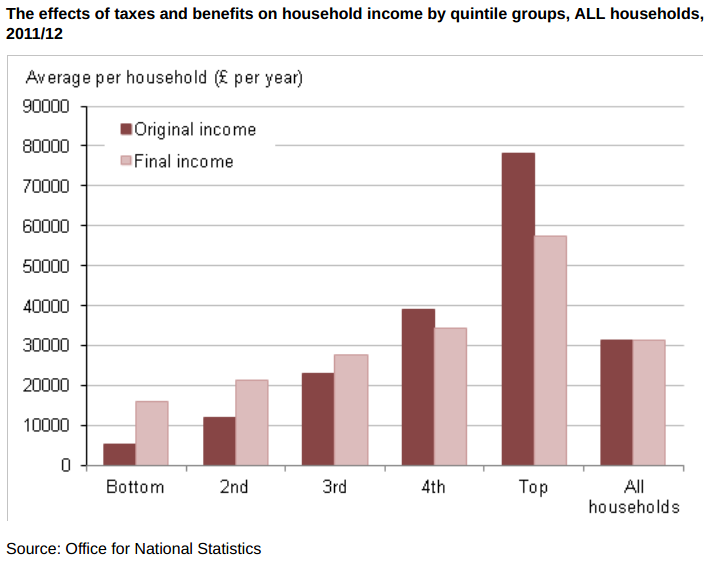
Average income is just over £30,000 on this calculation - by household. It is however more than double that before tax and not much less than double that after tax for the tope quintile.
But, and it is a massive but in this case, whereas the data for the first four bands is in a sense reliable because they have upper and lower boundaries the top quintile is a wholly unreliable view. It includes households well below the top rate tax band, and those earning millions. In the process this data hides a fact, which is very convenient to the government and which no doubt influenced the ONS headline writers, which is that within that top quintile there will be many who will have seen income fall - either because of public sector pay freezes, or cuts in child benefit or because private sector pay is sluggish, but that ignores the fact that for many right at the top the picture is very different indeed. They are seeing income and asset worth rising considerably and despite that this group pays lower tax overall than the lowest grouping.
That is what is so stagering about this data - and the way it has been represented. Britain is not becoming fairer. What is happening is that for well over 90% of households life is getting tougher and yet for a few it is astonishingly good - and lowly taxed.
That is the story that has to be told, and the issue that has to be corrected here.
Thanks for reading this post.
You can share this post on social media of your choice by clicking these icons:
You can subscribe to this blog's daily email here.
And if you would like to support this blog you can, here:


This is a fantastically important issue. The 2011/2012 graph that Richard presents is in itself extremely interesting, because it shows that wages at the bottom are so low as to require benefits to raise them to a sufficient level to live on. That in itself shows how the free market in wages is, by long but unspoken consensus, socially unacceptable. Unethical capitalism if you will. Richard’s point that the top quintile is unbounded is also crucial, and I think he is right that this is where our staggering ‘Friedmanite’ inequality is hiding.
I do believe that Friedmanite inequity has grown steadily since the 1980s, as the Spirit Level authors have shown. The ONS statistics need the kind of challenge that Richard is mounting, but on a sustained and high-profile level. What would help is to have the above graphs for the last thirty years. And what would really help is if there was a way to graph Richard’s point about the top quintile. I need to know more about it!
The data can only be approximated to using tax information – search HMRC statistics
Oh dear, that’s not very good. The published HMRC tables use broad income bands. Somewhere in a Government computer, there are the full underlying data. If they are publicly available, that’s great. If they are not, we can reasonably ask why not. I am not sure whether the the HMRC transparency initiative is going to go far enough, or whether it will get there fast enough:
http://www.hmrc.gov.uk/transparency/
Mike
http://www.hmrc.gov.uk/statistics/tax-statistics/liabilities.pdf
There’s lots of detailed stats about incomes, tax and numbers in this, should you wish to plough your way through it.
The ONS report has a graph showing the widening inequality over the last 30 years. Inequality widened under Thatcher, got better under Major, got alot worse under Blair/Brown, and now inequality is decreasing under Cameron/Clegg.
Only because real incomes are falling for those earning £40,000 – £60,000
Is that a success?
So bring in a prices and wages policy….ohh…that was tried once wasn’t it? Or make it illegal to have pay differentials…..but wait the TUs objected to that..as rightly they should have done.
Or put in place huge – and I mean eye watering tariffs on non-UK goods so that people are forced to purchase UK CD players and the like…..
..otherwise what’s the point of whining? White collar professionals earn shed-loads more than the average worker – so how do you propose to stop that?
“the fact that for many right at the top the picture is very different indeed. They are seeing income and asset worth rising considerably and despite that this group pays lower tax overall than the lowest grouping”
You’re right that putting households into such wide income bands distorts the picture on whether incomes are rising or not for those at the very top but you seem to then ignore that point when saying that such households pay lower tax overall. Someone very wealthy (income, say, £1m) will pay around £460k in tax/NI. That’s 46% of income before any spending on taxed goods and services.
Having such wide income bands may distort what’s happening to the incomes of the very wealthy but it also distorts how much those people pay in taxes.
Someone very wealthy (income, say, £1m) will pay around £460k in tax/NI.
…If they’re honest and aren’t squirreling it away in Cayman or Jersey…
I entirely agree that lumping together everyone in the top quintile will hide some important information. I guess that what we need are the raw data, so that calculations can be done by percentile – and perhaps on an even more refined basis at the top end, since the top percentile will straddle a very large range of incomes. I haven’t yet combed the ONS website to see whether these data are available.
One would have to recognize that chopping the data more finely (percentiles rather than quintiles) would increase the uncertainty due to sampling, but I would not expect that to undermine the main point, that the position of people on £1m a year is rather different from the position of people on £50,000 a year.
It would be interesting to know how the ONS computes the Gini coefficient. If they put the raw data into the formula, that would be one thing. If they put data already aggregated into quintiles into the formula, that would be another. Again, the answer may be on the ONS website. I am also not sure that it would make a big difference to the answer, given that a few people at extreme incomes, even very extreme ones, would not have too big an impact on the overall figure. (You might well regard this as saying that a single statistic, computed across the whole population, is an inadequate measure of inequality.)
Another point is often missed: an economy that shows 1% growth looks like a recession to everyone – and every company – who’s on the losing side of the concentration of wealth.
And if the winning 1% aren’t consuming as much as the rest, and if they’re not investing in the productive economy, but hoarding and rent-seeking
.. the 99% are correct in their recessionary assessment.
Nice to know that single pensioners do not count as households.
I am in the bottom quintile as far as my private pension goes. Add the state pension to that as a benefit and I only get ten thousand after tax, not the fifteen thousand as suggested by the graph. Not poor enough to get any more benefit.
The £15,000 is an average – not a description of a particular circumstance