John Christensen and I have been discussing UK lending data from the Bank of England this morning for a report he is writing. That report is not the issue here, whilst looking at the data I drew this graph (based on table C1.2 from the Bank of England, column DZ):
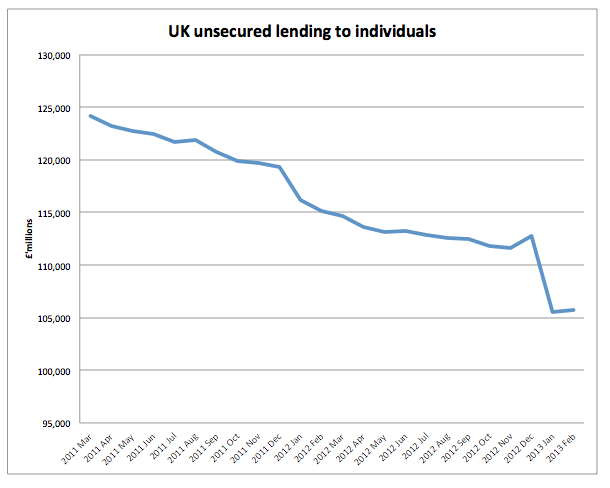
That's nearly £20 billion taken out of the economy in just two years.
No wonder the economy is flat.
Thanks for reading this post.
You can share this post on social media of your choice by clicking these icons:
You can subscribe to this blog's daily email here.
And if you would like to support this blog you can, here:


The counter-intuitive nature of our system of money creation is truly bizarre.
We’re told that if we ‘borrow’ it’s a good thing, especially if it’s for investment, unless its investment by the government, in which case it’s called ‘subsidy’, and that’s bad. And unless we borrow too much. Although borrowing too much for speculative purposes that drive up house prices and make housing unaffordable for millions on lower wages is good, but borrowing to employ the unemployed in providing public services for those in need is bad.
And if we pay off our loans that’s good too because it reduces unsustainable borrowing, but it’s also bad because it reduces the money supply and suffocates the economy. So we need to borrow more to spend on more things we don’t need, to keep the economy going, but somehow not get into more debt at the same time.
No wonder the majority of people are confused and apathetic!
Indeed
You need to be a bit careful with this data as it is impacted by the institution reporting into it, i.e. if a reporting institution sells a lending book then it simply diasappars from the data. Certainly the big drop between Dec 12 and Feb 13 is due to reporting changes. To get a more accurate picture of the changes, you need to look at the £ lending changes tab, which actually shows a £390m increase in amounts lent (which doesn’t seem logical to me, but is supposedly the correct data)
I merely used official data
It’s £20bn that was borrowed from the future and spent in the past. As it’s unsecured borrowing, we can assume that the benefit of the spending has largely been and gone. This is the post-credit-boom deleveraging that we should expect and desire.. and it shows that people, in aggregate, are coping well with the current climate.
I think this chart, in isolation, tells a good story. It’s the replacement (or not) of that demand from sources other than unsecured lending that’s the issue.