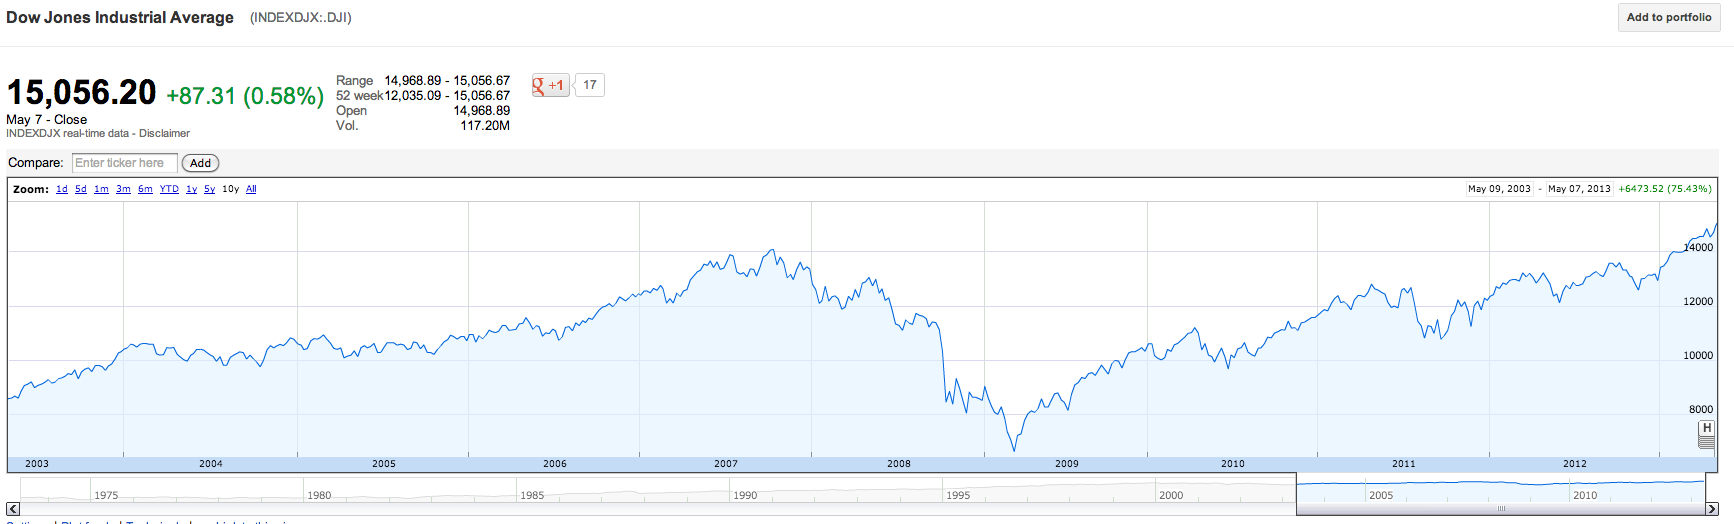
This is this mornings Dow Jones chart from Google Finance. I've plotted ten years:
 Just for the record, this is from the 1970s:
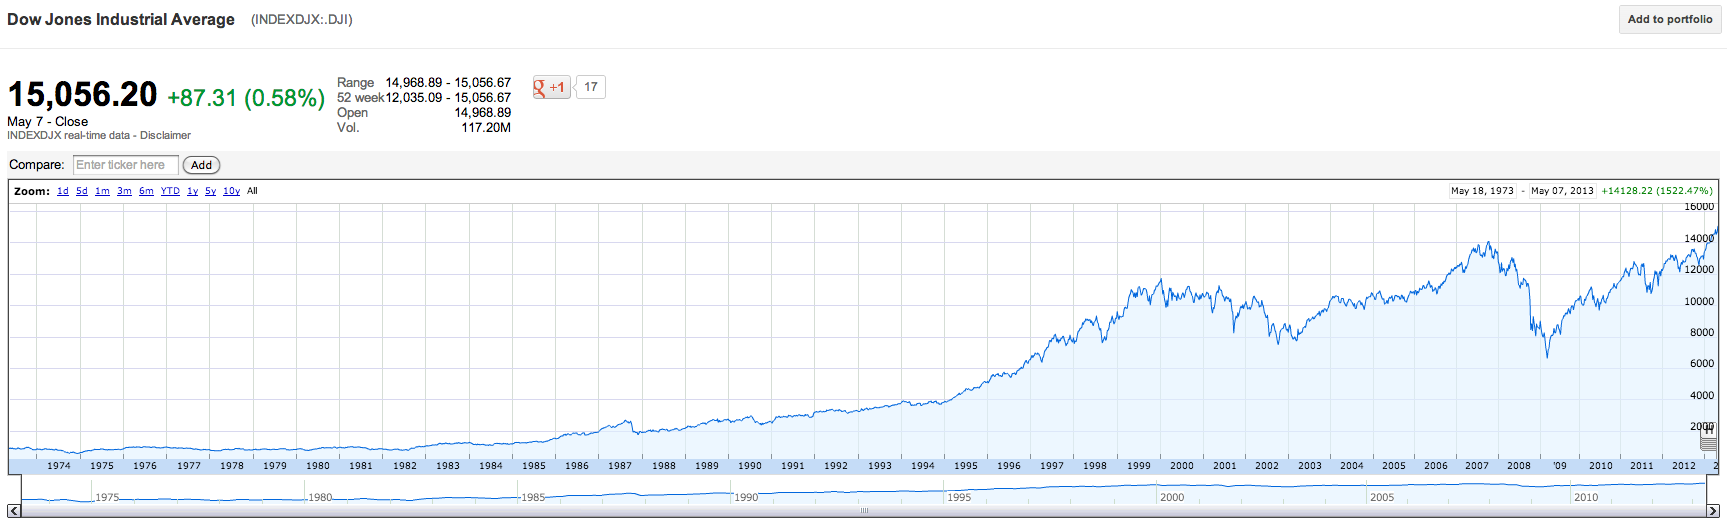 Don't worry that they're hard to read - it's the patterns that matter.
We're due for a bust soon.
There's absolutely no substance to the current boom, bar (perhaps) QE that's not being used for a Green New Deal. That won't last. And this is going to fall off a precipice, again.
How do I know that? Largely because the increases in the index are now being reported as mainstream news. That happened in 87, 99 and 07. I've been around a while now. It's happening again. It's a sure sign it's time to quit the markets.
Thanks for reading this post.
You can share this post on social media of your choice by clicking these icons:
You can subscribe to this blog's daily email here.
And if you would like to support this blog you can, here:


Richard,
The pattern of the coffee stain on my sofa also tells me the same 🙂
I’ve been casually following the S&P for the past few years and always wondered what exactly changed that made it increase so much. From my unsophisticated perspective it made no sense that while most economies are not doing better, in fact many are doing worse, the S&P has continued to increase to record high levels.. Boggles the mind
Richard,
You come up with this story every six months. One time you will be right, but it is only fair to say that markets are up 50% since you suggested the FTSE should be sub-3000.
Bloomberg had an interesting statistic last week, which is that it has taken 190 months for the Dow Jones to double, which is the longest period in history. The two doublings prior to that had taken 90-100 months, the one before that about 170 months. And there are plenty of solid companies like Rio Tinto trading at 30-40% below their recent highs.
No, not every six months
Only before highs – as I did in 2008, correctly
And in the last few months, again, correctly
In between I have only commented when the FTSE went over 6,000
You advised to sell when it was 3,500 on the basis that it should be 2,900
http://www.taxresearch.org.uk/Blog/2009/03/02/ftse-wait-till-its-sub-3000/
And then again at 5,500 on the basis that it should be 3,500
http://www.taxresearch.org.uk/Blog/2009/12/22/valuation-fundamentals-or-were-heading-for-another-crash/
Frankly it looks toppy to me at the moment but I’d expect it to reach 7,000-7,500 before a significant retracement.
Well there’s one way of settling this. Richard, are you prepared to make a specific prediction that the Dow will fall below x before a defined date t?[1] That way,we can revisit this later and either you or RP get to look smug.
[1] Let’s add the requirement that it stays there for a full uninterrupted trading day, so we exclude system failures, flash crashes and other transient events.
No
That’s absurd
And you know it
Don’t you mean ‘casino’?
Nigel Lawson seems happy with all this and barely perturbed. The NEF has been pointing out that credit creation has been ‘decoupled’ from the ‘real’ economy with bank credit channeled into financial transactions – the cost to society is clearly immense.
Richard, one of the elliott wave commentators I follow here – Graham Dyer – confirms what you say. It should have happened months ago, but we suspect there’s considerable market manipulation to prop things up. :-O
Gold is the other one to watch. Despite what all the gold bugs say, it’s heading for a big drop.
Well:
http://www.zerohedge.com/news/dark-pool-truth-about-what-really-goes-stock-market
http://www.zerohedge.com/news/dark-pool-truth-about-what-really-goes-stock-market-part-2